Monday, November 26, 2012


Warren Buffet on Taxes - a Minimum Tax for the Wealthy

Below is the Op-Ed piece that Warren Buffet did for yesterday's NY Times.  It is concerns his recommendations on how to tax the wealthy.  The excellent point that Mr. Buffet makes that is that given a good investment the tax rate on that investment seldom comes into play in the decision process.  This has always been my experience.  Taxes are just another cost in the investment return calculation.
The article is in italics and the bold is my emphasis.  From the NY Times:
SUPPOSE that an investor you admire and trust comes to you with an investment idea. “This is a good one,” he says enthusiastically. “I’m in it, and I think you should be, too.”
Would your reply possibly be this? “Well, it all depends on what my tax rate will be on the gain you’re saying we’re going to make. If the taxes are too high, I would rather leave the money in my savings account, earning a quarter of 1 percent.” Only in Grover Norquist’s imagination does such a response exist.
Between 1951 and 1954, when the capital gains rate was 25 percent and marginal rates on dividends reached 91 percent in extreme cases, I sold securities and did pretty well. In the years from 1956 to 1969, the top marginal rate fell modestly, but was still a lofty 70 percent — and the tax rate on capital gains inched up to 27.5 percent. I was managing funds for investors then. Never did anyone mention taxes as a reason to forgo an investment opportunity that I offered.
Under those burdensome rates, moreover, both employment and the gross domestic product (a measure of the nation’s economic output) increased at a rapid clip. The middle class and the rich alike gained ground.
So let’s forget about the rich and ultrarich going on strike and stuffing their ample funds under their mattresses if — gasp — capital gains rates and ordinary income rates are increased. The ultrarich, including me, will forever pursue investment opportunities.
And, wow, do we have plenty to invest. The Forbes 400, the wealthiest individuals in America, hit a new group record for wealth this year: $1.7 trillion. That’s more than five times the $300 billion total in 1992. In recent years, my gang has been leaving the middle class in the dust.
A huge tail wind from tax cuts has pushed us along. In 1992, the tax paid by the 400 highest incomes in the United States (a different universe from the Forbes list) averaged 26.4 percent of adjusted gross income. In 2009, the most recent year reported, the rate was 19.9 percent. It’s nice to have friends in high places.
The group’s average income in 2009 was $202 million — which works out to a “wage” of $97,000 per hour, based on a 40-hour workweek. (I’m assuming they’re paid during lunch hours.) Yet more than a quarter of these ultrawealthy paid less than 15 percent of their take in combined federal income and payroll taxes. Half of this crew paid less than 20 percent. And — brace yourself — a few actually paid nothing.
This outrage points to the necessity for more than a simple revision in upper-end tax rates, though that’s the place to start. I support President Obama’s proposal to eliminate the Bush tax cuts for high-income taxpayers. However, I prefer a cutoff point somewhat above $250,000 — maybe $500,000 or so.
Additionally, we need Congress, right now, to enact a minimum tax on high incomes. I would suggest 30 percent of taxable income between $1 million and $10 million, and 35 percent on amounts above that. A plain and simple rule like that will block the efforts of lobbyists, lawyers and contribution-hungry legislators to keep the ultrarich paying rates well below those incurred by people with income just a tiny fraction of ours. Only a minimum tax on very high incomes will prevent the stated tax rate from being eviscerated by these warriors for the wealthy.
Above all, we should not postpone these changes in the name of “reforming” the tax code. True, changes are badly needed. We need to get rid of arrangements like “carried interest” that enable income from labor to be magically converted into capital gains. And it’s sickening that a Cayman Islands mail drop can be central to tax maneuvering by wealthy individuals and corporations.
But the reform of such complexities should not promote delay in our correcting simple and expensive inequities. We can’t let those who want to protect the privileged get away with insisting that we do nothing until we can do everything.
Our government’s goal should be to bring in revenues of 18.5 percent of G.D.P. and spend about 21 percent of G.D.P. — levels that have been attained over extended periods in the past and can clearly be reached again. As the math makes clear, this won’t stem our budget deficits; in fact, it will continue them. But assuming even conservative projections about inflation and economic growth, this ratio of revenue to spending will keep America’s debt stable in relation to the country’s economic output.
In the last fiscal year, we were far away from this fiscal balance — bringing in 15.5 percent of G.D.P. in revenue and spending 22.4 percent. Correcting our course will require major concessions by both Republicans and Democrats.
All of America is waiting for Congress to offer a realistic and concrete plan for getting back to this fiscally sound path. Nothing less is acceptable.
In the meantime, maybe you’ll run into someone with a terrific investment idea, who won’t go forward with it because of the tax he would owe when it succeeds. Send him my way. Let me unburden him.
Saturday, November 24, 2012


Makers and Takers -  How They Voted

I personally am very tired about all the talk concerning "Makers and Takers" and how voted.  First, I do not care and second I am firmly against the mis-use of data.  If you do not use facts in a discussion then what is the basis of the discussion.  

The tacit assumption put forth by many Republicans is that the "Takers" voted for President Obama.  In reality the opposite is true.  Of the 27 areas (26 states plus the District of Columbia) won by President Obama 7 are defined as Takers (26%).  Of the 24 states won by Mitt Romney 20 were Takers (83%).  

The analysis below was posted at New Economic Perspectives, a site I encourage you to visit for some pretty interesting economic analysis and comment.  From New Economic Perspectives:

By the way similar analysis done by Bloomberg on the 2008 election demonstrated the same relationship.  Remember the 47% that Romney complained about during the campaign season, that is his base.

In any fiscal union, some states will benefit disproportionately from the way federal dollars are collected and allocated. In the US, roughly half of all states are net recipients of federal spending (i.e. they receive more in federal spending than they pay in federal taxes). These welfare queens are supported by fiscal transfers from the remaining states, who sacrifice their tax dollars but don’t enjoy the same investments in their infrastructure, industries, schools and communities.
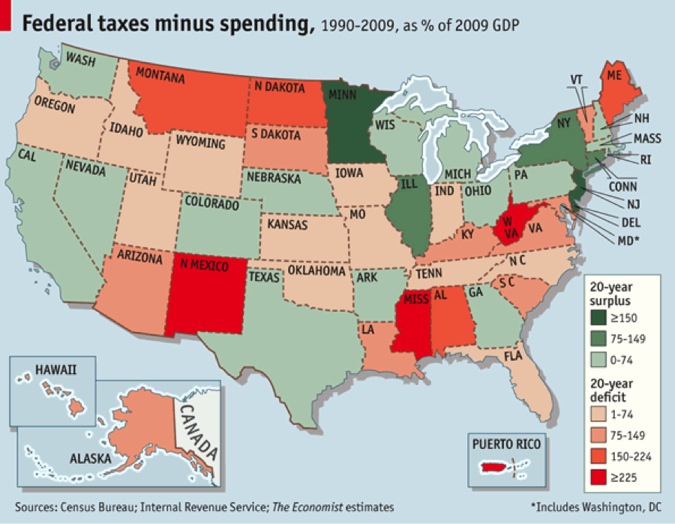
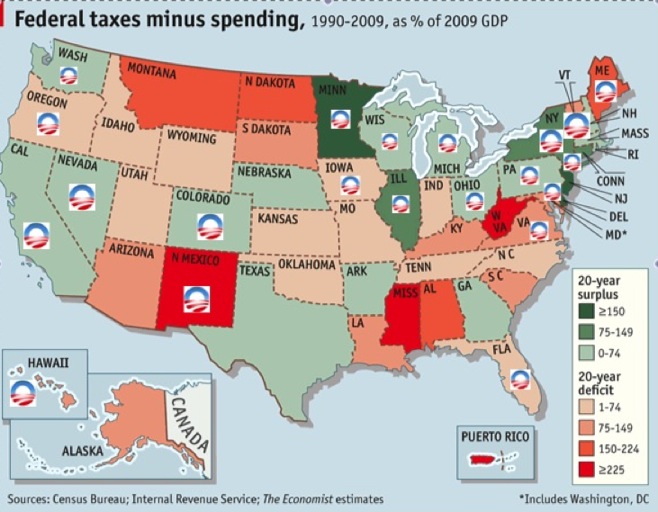
The figure below shows who the “takers” (shades of orange/red) and the “makers” (shades of green) are.
States like New Mexico, Mississippi and West Virginia take a lot. States like Oregon and Iowa take fairly little.  And then there are the takers in the middle, places like the great state of Virginia, where, from 1990-2009, “the federal government spent $1.44 trillion but collected less than $850 billion in taxes” (source).
Disappointed presidential hopeful Mitt Romney (along with Bill O’Reilly and others on the political right) has insisted that President Obama owes his reelection to the welfare moms and food stamp dads who wanted to be sure their sugar daddy stayed in office so he could keep funneling money away from society’s makers to these shiftless takers.
I thought it would be interesting to see how the real takers in our fiscal union voted.  Here’s the breakdown:
President Obama won 26 states plus the District of Columbia. Mitt Romney won 24 states.  Of the 27 regions that were won by President Obama, seven (or 26%) are net recipients of fiscal transfers.  Of the 24 states won by Mitt Romney, twenty (or 83%) are fiscal takers.
It’s sort of funny when you hear people on the political right talk about seceding from the union.  How long could they survive without their makers?


Tuesday, November 13, 2012

The US Will Become the Largest Energy Producer in 5 Years

According to the International Energy Agency the US will become the work's largest oil  producing country by 2017 and will become a net oil exporter by 2030.  This will be accomplished by increasing energy conservation and additional production especially from new technologies like fracking.  I copy of the report can be obtained from the IEA.

The article is in italics.  From the NY Times:


The United States will overtake Saudi Arabia as the world’s leading oil producer by about 2017 and will become a net oil exporter by 2030, the International Energy Agency (IEA) said Monday.  That increased oil production, combined with new American policies to improve energy efficiency, means that the United States will become “all but self-sufficient” in meeting its energy needs in about two decades — a “dramatic reversal of the trend” in most developed countries, a new report released by the IEA.

The foundations of the global energy systems are shifting,” Fatih Birol, chief economist at the Paris-based organization, which produces the annual World Energy Outlook, said in an interview before the release. The agency, which advises industrialized nations on energy issues, had previously predicted that Saudi Arabia would be the leading producer until 2035.
The report also predicted that global energy demand would grow between 35 and 46 percent from 2010 to 2035, depending on whether policies that have been proposed are put in place. Most of that growth will come from China, India and the Middle East, where the consuming class is growing rapidly. The consequences are “potentially far-reaching” for global energy markets and trade, the report said.
Dr. Birol noted, for example, that Middle Eastern oil once bound for the United States would probably be rerouted to China. American-mined coal, facing declining demand in its home market, is already heading to Europe and China instead.
There are several components of the sudden shift in the world’s energy supply, but the prime mover is a resurgence of oil and gas production in the United States, particularly the unlocking of new reserves of oil and gas found in shale rock. The widespread adoption of techniques like hydraulic fracturing and horizontal drilling has made those reserves much more accessible, and in the case of natural gas, resulted in a vast glut that has sent prices plunging..
The report predicted that the United States would overtake Russia as the leading producer of natural gas in 2015.
The strong statements and specific predictions by the energy agency lend new weight to trends that have become increasingly apparent in the last year.
“This striking conclusion confirms a lot of recent projections,” said Michael A. Levi, senior fellow for energy and environment at the Council on Foreign Relations.
Formed in 1974 after the oil crisis by a group of oil-importing nations, including the United States, the International Energy Agency monitors and analyzes global energy trends to ensure a safe and sustainable supply.
Mr. Levi said that the agency’s report was generally “good news” for the United States because it highlighted the nation’s new sources of energy. But he cautioned that being self-sufficient did not mean that the country would be insulated from seesawing energy prices, since those oil prices are set by global markets.
“You may be somewhat less vulnerable to price shocks and the U.S. may be slightly more protected, but it doesn’t give you the energy independence some people claim,” he said.
Also, he noted, the agency’s projection of United States self-sufficiency assumed that the country would improve gas mileage in cars and energy efficiency in homes and appliances. “It’s supply and demand together that adds up to this striking conclusion,” Mr. Levi said.
Dr. Birol said the agency’s prediction of increasing American self-sufficiency was 55 percent a reflection of more oil production and 45 percent a reflection of improving energy efficiency in the United States, primarily from the Obama administration’s new fuel economy standards for cars. He added that even stronger policies to promote energy efficiency were needed in the United States and many other countries.
The report said that several other factors could also have a large impact on world energy markets over the next few years. These include the recovery of the Iraqi oil industry, which would lead to new supply, and the decision by some countries, notably Germany and Japan, to move away from nuclear energy after the Fukushima disaster.
The new energy sources will help the United States economy, Dr. Birol said, providing continued cheap energy relative to the rest of the world. The energy agency estimates that electricity prices will be about 50 percent cheaper in the United States than in Europe, largely because of a rise in the number of power plants fueled by cheap natural gas, which would help American industries and consumers.
But the message is more sobering for the planet, in terms of climate change. Although natural gas is frequently promoted for being relatively low in carbon emissions compared to oil or coal, the new global energy market could make it harder to prevent dangerous levels of warming.
The United States’ reduced reliance on coal will just mean that coal moves to other places, the report says. And the use of coal, now the dirtiest fuel, continues to rise elsewhere.. China’s coal demand will peak around 2020 and then stay steady until 2035, the report predicted, and in 2025, India will overtake the United States as the world’s second-largest coal user.
The report warns that no more than one-third of the proved reserves of fossil fuels should be used by 2050 to limit global warming to 2 degrees Celsius, as many scientists recommend.
Such restraint is unlikely without a binding international treaty by 2017 that requires countries to limit the growth of their emissions, Dr. Birol said. He added that pushing ahead with technologies that could capture and store carbon dioxide was also crucial.
“The report confirms that, given the current policies, we will blow past every safe target for emissions,” Mr. Levi said. “This should put to rest the idea that the boom in natural gas will save us from that.”

Saturday, November 10, 2012

What is Quantitative Easing and What Is the Fed Trying to Accomplish?

Below is a really good explanation of Quantitative Easing (QE) and what the Fed is trying to accomplish with this policy.  Basically, when the ratio of household cash to total household market assets becomes too high the Fed applies QE to pull the money out of cash and into stocks or from a risk-off strategy to a risk-on strategy.

The article is in italics and the bold is my emphasis.  From Council of Foreign Relations:


The Federal Reserve thrilled markets last week (originally published 9/19/12) with the announcement that it would pump $40 billion into the economy each month through the purchase of mortgage-backed securities. Chairman Ben Bernanke justified this action by explaining that the Fed's tools "involve affecting financial asset prices."
Through the Fed's quantitative-easing programs, Mr. Bernanke has been trying more and more directly to push investors toward stocks and other financial assets in the belief that it will boost economic recovery. But the central bank has actually been steering asset prices for more than a decade now.
Between 1987, when Alan Greenspan became Fed chairman, and 1999 a neat approximation of how the Fed responded to market signals was captured by the Taylor Rule. Named for John Taylor, the Stanford economist who introduced the rule in 1993, it stipulated that the fed-funds rate, which banks use to set interest rates, should be nudged up or down proportionally to changes in inflation and economic output. By our calculations, the Taylor Rule explained 69% of the variation in the fed-funds rate over that period. (In the language of statistics, the relationship between the rule and the rate had an R2 of .69.)
Then came a dramatic change. Between 2000 and 2008, when the Fed cut the fed-funds target rate to near zero, the R2 collapsed to .35. The Taylor Rule was clearly no longer guiding U.S. monetary policy.
What happened? With the tech-bubble collapse, Japan's travails with deflation and stagnation, the turmoil following 9/11, and quiescent inflation, the Fed's focus began to shift. "New eras bring new challenges," observed Mr. Bernanke in late 2002, when he was a Fed governor. In a now-famous speech invoking the analogy of a "helicopter drop of money," he argued that monetary interventions that boosted asset values could help combat deflation risk by lowering the cost of capital and improving the balance sheets of potential borrowers.
Mr. Bernanke has since repeatedly highlighted asset-price movements as a measure of policy success. In 2003 he argued that "unanticipated changes in monetary policy affect stock prices . . . by affecting the perceived riskiness of stocks," suggesting an explicit reason for using monetary policy to affect the public's appetite for stocks. And this past February he noted that "equity prices [had] risen significantly" since the Fed began reinvesting maturing securities.
Since the collapse of Lehman Brothers in 2008, investors as a group have been jumping in and out of risky assets as sentiment shifts about the direction of government policy—Fed policy in particular. On Wall Street they call this "risk on, risk off." Since 2000, the Fed's efforts to turn markets on and off to risk have become so predictable that we've been able to infer a "rule" that is even more accurate than the Taylor Rule was in the 1990s.
Between 2000 and 2008, the level of household risk aversion—which we define as the ratio of household currency holdings, bank deposits and money-market funds to total household financial assets—explained a remarkable 77% of the variation in the fed-funds rate (an R2 of .77). In other words, the Fed was behaving as if it were targeting "risk on, risk off," moving interest rates to push investors toward or away from risky assets.
As the financial crisis unfurled in 2009, our descriptive rule predicted that the Fed would want interest rates below negative 2%. That being impossible as a practical matter, the Fed began quantitative easing to mimic the effect of negative rates.
In November 2008, the Fed began its first round of quantitative easing, purchasing $1.25 trillion in mortgage-backed securities and $500 billion in government-agency debt and longer-term Treasury securities through March 2010.
In November 2010, with the economy still struggling, the Fed launched QE2, purchasing $600 billion in Treasury securities through June 2011. And now, with the recovery still sputtering, the Fed has announced QE3.
The Fed's sustained targeting of "risk on, risk off" raises the serious question of whether bubbles are now more apt to form in various markets, ultimately resulting in greater volatility and damaging crashes.
Some Fed officials have openly expressed such concerns. In 2002, James Bullard, the current St. Louis Fed president, concluded on the basis of his own studies that "including equity prices in a Taylor-type policy rule will degrade economic performance." Last year, Dallas Fed President Richard Fisher warned against the risks of the Fed encouraging the view that there is a "Bernanke put" hanging over the market—that the Fed would "ease monetary policy whenever there is a stock market 'correction.' "
It took many years for the cumulative effect of tax and regulatory incentives for risk-taking in the real-estate and securitized-lending markets to nearly sink the economy. The Fed should be wary of making similar errors through the use of monetary policy.

What is the Fiscal Cliff and How Should it be Fixed?


The following is an excellent article from the Council of Foreign Relations (CFR) concerning the fiscal cliff.  In addition to describing the fiscal cliff, it explains the political issues behind how "we got here", the national impacts, the international impacts, and an historical perspective.  

The article is in italics.  From CFR:

The "fiscal cliff" is a term used in discussions of the U.S. fiscal situation to describe a bundle of momentous tax increases and spending cuts that are due to take effect at the end of 2012 and early 2013. In total, the measures are set to automatically slash the federal budget deficit by $607 billion or approximately 4 percent of GDP between FY 2012 and FY 2013, according to the Congressional Budget Office.  The abrupt onset of such significant budget austerity in the midst of a still fragile economic recovery has led most economists to warn of a double-dip recession in 2013 if Washington fails to intervene in a timely fashion.

But many analysts see little chance of a compromise before the November election, and questions remain on what action would be taken either in the lame duck session of Congress or in the early days of 2013. While taking no action could have deleterious economic effects in the short term, analysts say putting off or cancelling all of the measures without a long-term deficit deal in place would be equally dangerous for U.S. economic health.
What are the components of the fiscal cliff?
The following set of revenue and spending measures are set to expire or take effect at year's end, representing an acute fiscal consolidation that could be further intensified by a potential showdown over the debt ceiling:
over the debt ceiling:Federal Deficit Reduction in FY2013

Revenue Increases
  • 2001/2003/2010 Tax Cuts & AMT Patch. This series of legislation, often referred to collectively as the "Bush tax cuts," will expire on December 31, 2012, raising all income tax rates (top will go from 35 to 39.6 percent), as well as rates on estate and capital gains taxes. The alternative minimum tax (AMT) will also automatically apply to millions more citizens.
  • Payroll Tax Cut. The Social Security payroll tax holiday will expire December 31, raising the rate from 4.2 to 6.2 percent.
  • Other Provisions. Several other policies such as the Research and Experimentation tax credit, many of which are typically enacted retroactively, are due to sunset at years' end.
  • Affordable Care Act Taxes. Some provisions in the Obama health care legislation, including increased tax rates on high-income earners, are set to take effect in January 2013.
Spending Cuts
  • Budget Control Act. The automatic spending cuts or sequester legislated by the Budget Control Act of 2011 will hit January 2. Half of the scheduled annual cuts ($109 billion/year from 2013-2021) will come directly from the national defense budget, half from non-defense. However, some 70 percent of mandatory spending will be exempt.
  • Extended Unemployment Benefits. The eligibility to begin receiving federal unemployment benefits, last extended in February, will expire at year's end.
  • Medicare "Doc Fix." The rates at which Medicare pays physicians will decrease nearly 30 percent on December 31.
Debt Ceiling
The debt limit, which sets the maximum amount of outstanding federal debt the U.S. government can incur by law, is currently capped at $16.394 trillion. Treasury could hit this borrowing capacity again sometime in early 2013. Analysts fear another protracted debate on the debt ceiling could bring repercussions similar to those that followed the debt battle in summer of 2011, which rattled markets and, according to a study from the Government Accountability Office, raised the cost of borrowing by $1.3 billion for FY2011.

How did it come to this?
The fiscal cliff is in many ways the culmination of a series of increasingly contentious fiscal showdowns between the two parties over the last few years. The most noteworthy, the debt-ceiling fight of August 2011, threatened the country's ability to meet its financial obligations and resulted in an unprecedented downgrade in the U.S. credit rating by Standard and Poor's. The subsequent failure of the bipartisan super-committee to reach a deal on $1.2 trillion in targeted budget savings over ten years unleashed automatic spending cuts for both defense and non-defense spending.
Most critics believe that the lack of a comprehensive, long-term deal on deficit reduction--one that addresses the need for major tax and entitlement reform--has propelled the use of short-term political expedients like the "doc fix" and other extenders. Meanwhile, the nation's debt soars on an unsustainable path, according to most projections.
Taxes and the role of government lie at the heart of the debate. Generally speaking, Republicans favor spending cuts as a primary means to achieve deficit reduction. Most have also publicly pledged to oppose all tax hikes, suggesting growth through tax cuts will increase revenue. Democrats typically believe tax increases should be part of any bargain to reduce long-term entitlement spending, and have generally supported greater reductions in defense spending.
This philosophical rift is on display in the debate leading up to the fiscal cliff. The two parties are divided over how to extend the Bush-era tax cuts, the largest single component of the fiscal cliff. Republicans, including presidential candidate Mitt Romney, are pushing for all cuts to be extended, while many Democrats, led by President Obama, would extend all cuts except for the wealthiest 2 percent of taxpayers. The fight over taxes is also very much part of the sequester debate (Politico), with Democrats pushing for more revenue as part of any deal to avert the drastic mandatory cuts.

What are the domestic consequences?
A $607 billion budget contraction in 2013 would likely send the United States into another recession in the first half of the year, according to the CBO. In such a scenario, analysts project real economic output in 2013 to grow at just 0.5 percent, resulting in lower taxable incomes and higher unemployment (one to two million).
International shipping giant UPS, which is often considered a bellwether for the business community at large, has already reduced its growth forecast for the second half of 2012 to just 1 percent, citing the climate in Washington (The Hill). "[Our] customers are concerned. They're not going to invest. They're not going to hire people. They're not going to stock inventory with all that uncertainty," said CEO Scott Davis.
A July report from Morgan Stanley (WashPost) similarly states the company is already experiencing cutbacks in business orders and hiring, and notes that "the negative impact of fiscal cliff uncertainty is becoming more widespread."
Moreover, a report from the bipartisan Committee for a Responsible Federal Budget (CRFB) suggests CBO projections "may underestimate the pain associated with the fiscal cliff since they do not fully account for the continued market uncertainty or the potential 'hysteresis' associated with continued long-term unemployment." In economic theory, labor market hysteresis occurs when persistently high unemployment fosters even higher levels of joblessness in the long term due to a number of causes (i.e., the skills of long-term unemployed diminish, thereby reducing the chances of becoming re-employed.)

What are the national security implications?
Automatic, across-the-board spending cuts of approximately $55 billion per year (through 2021) are scheduled to hit the Pentagon in January unless Congress steps in before the new year. Details of how the cuts will be enacted are yet to be fully worked out by the White House Office of Management and Budget, but some preliminary decisions have been made. In late July, President Obama exempted all members of the military from the potential cutbacks, an authority granted to the White House under the 2011 Budget Control Act (TheHill).
The decision will likely shift the burden of sequester cuts onto other areas of the Pentagon, including weapons programs. Defense contractors have already condemned the sequester as a potential "jobs killer." A fact sheet from the Republican-controlled House Armed Services Committee describes the looming defense cuts as an "unacceptable risk" that will "severely diminish America's global posture" and lead to the loss of over one million private sector jobs.
Similarly, the White House has described the potential cuts as "highly destructive to national security and domestic priorities, as well as to core government functions," and continues to push for a political compromise that would avert major cuts.

What are the global consequences if Congress fails to act?
The repercussions abroad would likely be significant if Congress is unable to at least temporarily stave off the acute onset of year-end tax increases and spending cuts. A July 2012 IMF report notes that massive fiscal tightening in the United States in early 2013 is a primary risk to global economic stability. Protracted gridlock in Washington would stall the U.S. recovery "with significant spillovers to the rest of the world," say experts. In addition, "delays in raising the federal debt ceiling could increase risks of financial market disruptions and a loss in consumer and business confidence."

What are the practical policy considerations?
Economists suggest a more prudent compromise would involve extending some current provisions either indefinitely or at least temporarily in order to avoid undercutting economic growth. The IMF advises U.S. policymakers to pursue tax and spending policies that bring down the 2013 deficit by a more modest 1 percent. At the same time, analysts say policymakers should forge a credible plan to impose a requisite amount of medium to long-term fiscal consolidation.
A host of public and private policy groups have proposed more than thirty different deficit reduction approaches that address the root problems of soaring U.S. debt: an aging population, longer life expectancies, and rising health care costs. A fiscal cliff dive, on the other hand, would significantly slash the deficit but would not address the fundamental drivers of long-term U.S. debt. A comprehensive deficit deal would map out a gradual schedule of targeted tax and entitlement reforms that businesses, individuals, and government agencies can plan for and adjust to.
The sooner such a plan can be worked out, the better, say analysts. "Failure to make the hard but necessary choices now on our own terms will lead to much harder and more severe choices later" at the behest of the markets, says CRFB. Continuing to grow the debt at unsustainable levels threatens to trigger a sharp increase in U.S. borrowing costs and further downgrades to the nation's credit rating. While global investors may continue to fund high U.S. deficits for several more years, recent experiences of several advanced economies in Europe indicate the unpredictability and speed at which fiscal crises can come.

What are the prospects for progress over the next few months?
Analysts say the approaching fiscal crisis at year's end offers Republicans and Democrats yet another opportunity to strike a balance between the short-term measures needed to feed the recovery and the medium to long-term policies that will stabilize and eventually lower the debt. But prospects for a significant political compromise that averts the fiscal cliff (Reuters) before the November election is highly unlikely, and some speculate that lawmakers may even wait until a Congress is seated in January before any action is taken.
Timeline: Marching Toward the Fiscal Cliff
The theory behind a deliberate cliff dive (CSM) would be to enable election winners to return to Washington with swollen coffers in January, hit the reset button, and put together a new package of policies they can frame as "tax cuts." Part of the recouped revenue could also be used for deficit reduction. Some think policymakers are already telegraphing this strategy in order to inoculate the markets. Even if there is a temporary crisis, it would likely only last a couple months before recessionary pressure forces Congress into action, some analysts say.
Expectations for a pre-election deal that would put the brakes on the $1.2 trillion in automatic budget cuts are also quite low. While both parties have expressed opposition to the "meat axe" approach to deficit reduction (WashPost), they remain divided on a workable alternative. However, similar budget sequesters in 1988 and 1990 (PDF), which were reduced or erased by subsequent legislation, may offer insight into a likely outcome.
Dodd-Frank and the Effect on the Banking Industry 

Is there such a thing as too small to survive?  Basically, the need for more capital, low interest rates, sluggish loan demand, and the dominance of the large banks have made it difficult for the small community banks to survive.  The question that needs to be asked is - is thing a good thing?  Another question to ask is should we be instituting the (state) government run community bank.  North Dakota has them now and it is the only state in the country that allows this type of bank.  However, this idea is catching on very rapidly in other states.

The article is in italics and the bold is my emphasis.  From Fortune:

Now that President Obama has been re-elected, analysts, consultants and dealmakers have turned from whether Dodd-Frank will be repealed to what it means for banks now that it's likely here to stay. The overwhelming conclusion: Thousands of small banks will soon disappear.

Emmett Daly, a Sandler O'Neill dealmaker who specializes in small banks, predicted at an industry conference put on by Mergermarket on Thursday that the number of banks in the U.S. would shrink to a few hundred. There are currently more than 7,000. Bill Egan, head of financial institutions investment banking at Bank of America Merrill Lynch, agreed, but said the weeding out process was likely to take more than a decade.

Indeed, the deal this week to buy bank adviser KBW by larger rival Stifel Financial appeared to be motivated by the belief that more banks would have to make deals. Says Rochdale Securities bank analyst Dick Bove, "It's fairly clear that 50% of the banks in the U.S. need to be recapitalized."

Kamal Mustafa, who heads up bank consulting firm Invictus and is a former Wall Street M&A banker, says it's not just Dodd-Frank. Low interest rates and the Fed's annual stress tests are making it tough for small banks to survive as well. His firm looked at bank profits and capital rules and came to this conclusion: Nearly 2,000 banks need to sell. "There are a large number of banks that are limping toward oblivion," says Mustafa. "Capital requirements have gone up too fast, and rates have gone too low. There's no way out."

Like post offices and small businesses in general, law makers are likely to come to the rescue of small community banks. What's more, at least so far small banks haven't done significantly worse under Dodd-Frank than big banks.

Still, it's probably true that all the rules we have lumped on the banking industry in a good faith effort to make our financial system safer will most likely make it harder for small banks to stick around. The real question is how much we should care.

Canada, afterall, has less than two dozen banks, and by most accounts it's banking system did pretty well in the financial crisis. What's more, the vast majority of lending, something like 90%,  in this country is done by the nation's 50 largest banks. So losing nearly 7,000 banks would only cut off credit to 10% of borrowers at most.

Joseph Mason, a finance expert at Louisiana State University, says there's no hard economic evidence to show whether small banks benefit the economy or not. Nonetheless, Mason says he falls into the camp that believes small banks are good for the U.S. He says competition matters. And while small banks only make up a small portion of lending, the types of loans they do, to local businesses that large banks might deny, may matter.

But all this comes at a cost. The Federal Deposit Insurance Corp. has spent tens of billions saving mostly small banks over the past few years. Is it worth it?

In the mortgage market there appears to be somewhat of an answer. Home loans are dominated by a few large banks, Wells Fargo and J.P. Morgan, mostly. Small banks have largely been pushed out. The result: Mortgage rates are about one percentage point higher than they would be if we had more competition. Apply that to all mortgages, and that higher interest rate costs consumers about $100 billion a year in extra interest. Not to mention all those who can't actually get refinanced. I'd say that's pretty good evidence that we should figure out a way to keep small banks around.

Thursday, November 8, 2012

Investors continue to Pull Money Out of the Stock Mutual Funds

Investors continue to pull money out of stock mutual funds and put in bond mutual funds.  Also balanced funds (mutual fund with both stocks and bonds) continue to do well.

From CNNMoney.com:


With the two-day market shutdown due to Hurricane Sandy, investors didn't do much with their money last week.
Overall, they pulled $488 million from long-term mutual funds in the week ended Oct. 31, according to the Investment Company Institute. . . . 
. . . . The limited activity was partly due to the closure of the US financial markets on Oct. 29 and Oct. 30 as New York City coped with the aftermath of Superstorm Sandy, including widespread power outages and a halt in public transportation.
Mutual funds were closed for both redemption and purchases during those two days as well, and any transactions that investors had planned were likely pushed to later in the week, said Shelly Antoniewicz, senior economist at ICI.
But that wasn't the only reason investors sat on the sidelines. With President Obama and Republican challenger Mitt Romney running neck-and-neck, uncertainty about the outcome of the presidential election left many investors unwilling to place any big bets.
During the shortened week, investors pulled $1.9 billion from U.S. stock mutual funds, bringing the year's total outflow to more than $110 billion.
They added just $2.6 billion to bond funds, the least since early July. So far in 2012, bond funds have attracted nearly $300 billion.
The ICI data also show that hybrid funds, which invest in both stocks and bonds and have been extremely popular among investors this year, lost $672 million last week.


Investors pulled $1.9 billion from U.S. stock mutual funds during the latest week, bringing the year's total outflow to more than $110 billion.


Monday, November 5, 2012


China, the Fiscal Cliff, Energy Prices, Profits, and QE3 and Their Effects on the Stock Market

China, the Fiscal Cliff, energy prices, profits, and QE3 are the primary concerns in today's worldwide  economy.  How will these effect the stock market?  This is the point of the article by A Gary Shilling.

The article is in italics and the bold is my emphasis.  From Bloomberg.com:

The growing gulf between the behavior of investors enamored with monetary and fiscal largess and the reality of globally weakening economies -- a phenomenon I call the Grand Disconnect -- is profoundly unhealthy.

It will end, sooner or later, in any case. One way it could be eliminated is through the rapid expansion of economies globally. The past and current massive monetary and fiscal stimulus or other forces might rekindle growth. Some investors point to the recent stabilization of U.S. house prices as the beginning of a revival.

I have my doubts. The huge deleveraging in the private sector in the U.S. and abroad; the unresolved odd-couple tensions between the Teutonic North and the Club Med South in the euro zone; and the needed shift in China from an export-led economy to one powered by domestic consumption suggest that “risk on” investments will collapse to meet recessionary and chronically slow-growing economies.

What will cause the agonizing reappraisal by bullish investors? Probably a shock, as was the case in limited ways with the euphoria over the first two rounds of quantitative easing by the Federal Reserve and Operation Twist. The Greek debt crisis in early 2010 ended the QE1 stock rally. The QE2- spawned bull market ended in early 2011 with the second flare-up of Greek worries and the widening European financial and economic woes. The optimism generated by Operation Twist concluded with the realization that Europe’s travails may be unsolvable, and with worries about the fiscal cliff in the U.S.

Forecasting specific jolts is hazardous, though I can list several possibilities.

A hard landing in China might do the job, with growth slowing to between 5 percent and 6 percent, especially after the effect is felt in world trade, commodities demand and prices and commodity producers’ currencies. There is a growing consensus that this is in the cards. That view could account for the recent embryonic shift from “risk on” positions -- the quartet of short Treasury bonds, long stocks, short the U.S. dollar and long commodities -- to the reverse “risk off” trades.

A fall off the fiscal cliff is another possibility. If Congress and the administration don’t act by the end of this year, the Bush-era tax cuts will expire, the payroll tax on employees reverts to 6.2 percent from 4.2 percent, unemployment benefits drop from a 99-week maximum to 26 weeks, and $1.2 trillion in mandatory federal-spending cuts and tax increases over 10 years begin to kick in. The nonpartisan Congressional Budget Office estimates that the fiscal cliff will cut 2013 gross domestic product by 4 percent. In itself, that has the makings of a major recession, and its effects would be compounded in an already recessionary economy.

I believe that the U.S. government will avoid the fiscal cliff, at least temporarily. Even the representatives and senators affiliated with the Tea Party want to be re-elected, and telling their constituents that austerity is good for their souls won’t garner them many votes. With the current Congress and administration gridlocked, they could use a so-called lame- duck session after the election to postpone the tax increases and spending cuts, leaving the next Congress and administration to deal with the mess. That’s what happened last December --when they negotiated a three-month respite -- and again in February, when they delayed action for the rest of this year.

Or they could wait for a new administration to be sworn in and tackle the fiscal cliff retroactively.

One way or the other, I doubt the economy will go off the fiscal cliff. An old friend, former Representative Barber Conable of New York, who served as the ranking Republican on the House Ways and Means Committee and later as president of the World Bank, often told me that “Congress ultimately does the necessary thing, but only when forced to and as late as possible.”

Few in Washington are likely to stand on principle and let the economy fall into an abyss.
I doubt that many U.S. business people and consumers believe the fiscal cliff won’t be averted, even though many cite the threat as a rationale for the general uncertainty that is retarding spending and capital investment. Note, however, that defusing the fiscal-cliff menace won’t add stimulus to the economy. It will simply keep existing government spending and tax rates intact.

Another possibility is that a surge in the price of oil, possibly triggered by an Iran-related crisis in the Middle East, shatters investor euphoria. That’s what happened with the oil embargo in 1973 and Iran’s Islamic Revolution in 1979. To be sure, the U.S. is becoming less dependent on imported energy, and little of the imported oil is from the Middle East. But petroleum is fungible and price increases elsewhere will affect the U.S., along with Europe and China. A huge energy-cost increase would be a debilitating tax on already-stressed consumers.

There also is the danger that a major European bank will fail, generating a global financial crisis. Banks are so intertwined through loans, leases, derivatives and other instruments that a blow in Europe would be felt around the world.

Banks normally look at their derivatives exposure on a net basis after hedges and other offsets are accounted for. But the gross or notional value of derivatives is 26 times the net, according to the Bank for International Settlements, and if a bank goes belly up, the counterparties are stuck with the notional amount.

Add major corporate-earnings disappointments to the list of possible shocks. Ever-optimistic Wall Street analysts believe S&P 500 operating earnings fell slightly in the third quarter compared with the year-earlier period, but a 14 percent revival is expected in the fourth quarter. Yet suppose my forecast is correct and operating earnings drop to $80 per share over four consecutive quarters, due to recession-induced declines in corporate revenues, a narrowing of profit margins from record levels and currency-translation losses as the dollar strengthens. That $80 is more than 20 percent lower than analysts’ estimates, and would be a big disappointment to many bullish investors.

QE1, QE2 and Operation Twist got increasingly larger bangs for the buck. But that isn’t the case with QE3 and recent actions by the European Central Bank, at least so far. Each successive announcement by the Fed and ECB got less pop in the S&P 500. Since peaking Sept. 14, the day after QE3 was announced, that index has been relatively flat, in contrast to gains in comparable days of trading after the three earlier quantitative easings. Treasuries, which changed little after the first rounds of easing, had a brief rally.

It’s early into QE3, but does this suggest that investors are getting cautious and wary, and believe the Fed has gone back to the well one time too often? Are investors anticipating a hard landing in China or one of the other shocks I outlined?

This series makes clear that I disagree with the “It’s so bad, it’s good” crowd. Conditions are so bad, they are just plain bad. The huge monetary and fiscal stimulus in the U.S. and elsewhere in the past five years has failed to offset the gigantic deleveraging in global private sectors. And such measures are unlikely to do so until that process is completed in another five to seven years.