Monday, December 31, 2012

ECRI Says the Recession Started in July 2012

According to ECRI the recession they predicted in September of 2011 started in July 2012.  Before getting upset the last paragraph in the blog explains the recessions are part of the business cycle, so it is just part of life.  

Article is in italics and the bold is my emphasis.  From ECRI:

Following our September 2011 recession call, we clarified its likely timing in December 2011. Based on the historical lead times of ECRI’s leading indexes, we concluded that, if it didn’t start in the first quarter of 2012, it was very likely to begin by mid-year. 

But we also made it clear at the time that you wouldn’t know whether or not we were wrong until the end of 2012. And so it’s interesting to note the rush to judgment by a number of analysts, already asserting that we were wrong.


So, with about a month to go before year-end, what do the hard data tell us about where we are in the business cycle? Reviewing the indicators used to officially decide U.S. recession dates, it looks like the recession began around July 2012. This is because, in retrospect, three of those four coincident indicators – the broad measures of production, income, employment and sales – saw their high points in July (vertical red line in chart), with only employment still rising.
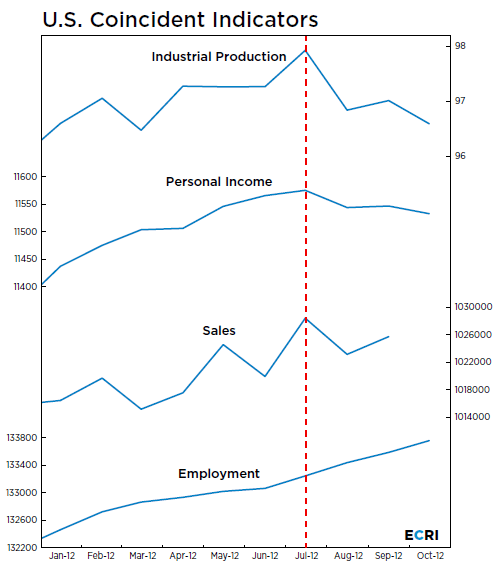


But if we’re in recession, and the business cycle peak was in July, how could employment be higher three months later? Actually, this was also true in three of the last seven recessions – and in the severe ’73-’75 recession, job growth stayed positive eight months into the recession. Thus, positive jobs growth isn’t inconsistent with the early months of recession. Of course, all of this data is subject to revision, but, as we’ve noted before, the ultimate revisions to coincident indicator data after business cycle peaks tend to be downward. 

If you look at the size of the simultaneous declines in industrial production and personal income since July, that combination has never occurred outside a recessionary context in over half a century – but it’s occurred in every recession. This leads us to conclude that we are most likely already in a recession that began around mid-2012.   
Now, please remember that, following our recession call, central banks really ramped up their efforts, and have literally been pumping more money into the economy than at any time in the history of humanity – and this is the upshot. No wonder the Fed is now all in.

So how come hardly anybody recognizes the recession? Perhaps it’s because of real-time data showing positive growth in GDP and jobs, and the lack of a recent salient shock.

Many believe a major negative shock is necessary to start a recession. But think back to the big shocks in the last two recessions. The 9/11 attacks were widely believed to have triggered the 2001 recession that had really started six months earlier. And many thought that the financial turmoil set off by the Lehman Brothers failure caused the 2007-09 recession that had actually begun nine months earlier.
 
At the time, with seemingly positive – indeed strongly accelerating – GDP growth in the first two quarters of 2008, most didn’t realize that a recession was already in progress when Lehman collapsed. The week after, Chairman Bernanke, pressing Congress to enact the TARP legislation, said to the Senate Banking Committee that if it wasn’t passed, “jobs will be lost … [and] GDP will contract” – namely, a recession would ensue.

Sounding a similar tone last week, he warned that if the fiscal cliff wasn’t avoided, it “would send the economy toppling back into recession.” Once again, he seems unaware that a recession is underway.

So, what does this recession mean for people? The bottom line is that production, income and sales will keep trending down for now, and employment too is likely to turn down. 

Nobody likes to be the bearer of bad news, but a recession isn't the end of the world. There have been 47 recessions in the past 222 years and, as before, we’ll see renewed growth after the 48th. Because business cycles are part and parcel of how all market economies operate, that’s about as close to a sure thing as it gets.

Sunday, December 30, 2012

Student Loans - The Kiss of Death

As my kids will tell you I am an outspoken critic of student loans.  I believe they are the kiss of death for young people.  It is "easy" money that is very expensive to obtain (watch out for the fees), that are hoisted on to the backs of our young before they are old enough to really understand what they are getting.  

I recently talked to a young person about re-structuring their student loans and determined that  currently they have a non-federally-insured loan with about $66,000 in principal, a term of 30 years and an interest rate of 5.5%.  If they pay on that loan every month for 30 years they will pay over $68,000 in interest.  I (and the author) see that as $68,000 in lost consumption potential or opportunity cost for a large portion of a generation.

Some ask, "How am I supposed to go to school without student loans?".  Instead of telling you what to do, let me tell you what I did.  I did not own a car until I was in graduate school, I lived at home as an undergraduate, I worked part-time, I started working at 12 and worked more or less continuously through my college years, I saved everything, my parents agreed to pay my tuition and fees only at a state-supported University, everything I received as gifts (birthdays, etc.) was saved, I did not eat out very often, I majored in a subject that guarantied me a job when I graduated, and as a result I graduated without any student loans.  When I got out of school I was free to spend my money as I saw fit because I had no student loans.  Did I live like a pauper?  You betcha.  Did I start at a community college to keep the costs down - of course.  But in the long run I was better off for it.  

The article (post) is in italics and most of the bold is my emphasis.  From Global Economic Interest:

I encourage you to visit the original post.  It has some interesting links that are worth a read.

. . . . . Monthly, we report on consumer credit noting that the majority of money flows into consumer credit is due to student loans.

The red line on the above graph is the growth of consumer credit after subtracting student loans.  Currently, not considering student loans – consumer credit is growing at $200 per year for every person 18 years or older in the USA.
Student loans, however, are not obtained by the majority of the population – most is targeted to a small group 18 to 26 years old.  The average debt burden on this segment per capita is growing at an annual rate exceeding $2,000.
Here are some random statistics from the American Student Assistance (ASA) website:
  • close to 12 million – or 60% of all students – borrow annually to help cover costs.
  • there are approximately 37 million student loan borrowers with outstanding student loan – and 14%, or about 5.4 million borrowers, have at least one past due student loan account.
  • among all bachelor’s degree recipients, median debt was about $7,960 at public four-year institutions, $17,040 at private not-for-profit four-year institutions, and $31,190 at for-profit institutions.
  • the average student loan balance for all age groups is $24,301.
The lead NY Times article, however, was not about those who graduated – but about those who dropped out.  Here the ASA website offered the following perspective.
  • nearly 30 percent of college students who took out loans dropped out of school, up from fewer than a quarter of students a decade ago.
  • more than half of students who take out loans to enroll in two-year for-profit colleges never finish. At traditional nonprofit and public schools, the percentage of students with loans who started college in 2003 and dropped out within six years is about 20 percent.
. . . . One significant factor that differentiates the U.S. from other countries:  Many countries educate their young at no cost to the students.  It remains to be determined by other analysis which approach to funding higher education has any economic advantage.  At this juncture it appears that a generation is being saddled with debt they may not be able to repay – and that could well be the deciding factor in the economic analysis.
My weekend posts are geared to identifying specific elements of the USA economic system which are creating growing headwinds for future economic growth.  It is hard to believe student loans are a healthy societal benefit (or investment) in the future.  However, I have difficulty espousing solutions:
  • Is higher education’s purpose to provide specific skill sets, or just provide a broad general education for employers to finish the training? Are we graduating too many “arts” degrees?
  • With reduced funding levels, high school (secondary school) is graduating students with no specific skills.  Should secondary education be teaching specific skill sets such as mechanics, welding, agriculture, etc?
  • Should higher learning institutions be burdened with responsibility for educating in fields where there are jobs? Should the government be involved?  Business?
  • Should students be counseled before deciding their course of study (specifically jobs availability) or taking any student loan (showing how this burdens their future options)?
I do not believe there are any good or perfect solutions – but the current path for the USA is clearly wrong.  The USA is a consumption based economy, and the young entering the workforce are not able to provide economic tailwinds if they enter the economy already burdened with debt.

Saturday, December 29, 2012

Household Formation and the Recovery

Below is an article I recently saw that brings up interesting statistics that you never hear about - household formation.  Household formation is in simplest terms is what happens when the children move out on their own and form their own household.  The result is an increase in spending on everything from beds to dish soap.  As you might guess, this can really drive a recovery.  I have included this article because it has some interesting graphs and discusses the whole issue of household formation.  I strongly disagree with the author about his views on a housing boom.  I think the US economy needs to figure out how to recover without depending on housing.

The article is in italics and the bold is my emphasis.  From the Atlantic:

Derek Thompson references graphs from 34 contributors, which are interesting in their own right.  If you would like to see these go to the Atlantic #2:

Derek also references a Credit Suisse study which is also very interesting and also the source of many of the graphs.  This can be found at CS:

By the way, if you are looking for well-written articles that are well researched and thought-provoking on timely subjects you have to include The Atlantic magazine in your search.  I have read a lot of their articles over the years and even though I may not always agree (that is OK) the articles are always excellent.

The most important graph of 2012? We asked around for some suggestions last week. We got 34 responses. This was mine. It answers the question: What share of each recovery since 1970 came from selling houses and cars?

Houses_and_Cars_Growth2.PNG

The message is that home and car sales power recoveries. This recovery is different from all others because we just. Aren't. Selling. Enough. Houses. 

That might be changing. With home prices rising, construction hours-worked recovering, and multi-family homes making a sustained comeback, 2013 could be the year our economy breaks out of "new normal" growth and gets back to "normal normal" growth.

Behind my optimism is a trend that doesn't get a lot of play in some corners of the financial press. It's household formation. Household means is a group of people living together. It can be six roommates, a four-person nuclear family plus a grandmother in the guest room, or a a young couple of two. Formation means one more of those categories. More formations is good news. It suggests more people getting jobs, getting apartments, getting married, having kids, and (in all likelihood) spending more money to furnish their new households and express their independence.

This recovery, however, has been a story of few jobs, crowded apartments, low marriage-rates, and low birthrates. It all comes down to households. In 2007, household formation (in RED) went horizontal, clearly diverging from our two-decade growth trend (graphs below via Credit Suisse):

Screen Shot 2012-12-21 at 12.11.04 PM.png

Unemployment among Millennials is about twice the national average, and real wages for young people have declined outright since 2007. As a result, one in three older teens and twenty-somethings reported moving back in with their parents. That means they weren't starting new households. They weren't paying rent, taking out mortgages, buying furniture, paying separate utility bills -- all of which fall under the Housing Category, which accounts for nearly a fifth of GDP.

Consider Florida, our fourth-largest state economy and perhaps the worst-hit by the housing crash. The graph below shows the percentage of 25- to 34-year-olds who head a household (renting or owning). "In 2006, half of Floridian young adults had their own place," Credit Suisse reports.  Five years later, 20 percent of that group had moved in with their parents or somebody else. That's an astounding demographic shock to a real-estate-centric economy.

Screen Shot 2012-12-21 at 12.22.44 PM.png
Okay, but here's the good news. Household formation is miserable now, but it's projected to pick up for a simple reason: an improving economy is bound to encourage young people to get out, buy apartments, and get married, eventually. How fast they start gobbling up apartments and houses is unclear. But Credit Suisse makes three projections: No recovery (unlikely), strong recovery (possible), and consensus recovery (plausible). Here's the impact of each recovery speed on US household formation over the next year.

Screen Shot 2012-12-21 at 12.22.28 PM.png

And here is how that would translate into more spending on houses (or "residential investment"). Basically, a strong household recovery would coincide with a residential investment boom that took us to 2005 highs.

Screen Shot 2012-12-21 at 12.20.50 PM.png


Housing probably isn't going to snap back to its pre-bubble peak in the next year. But even normal growth in residential investment would be huge. If residential investment simply returns to its long-term average (going back to the 1990s), "it would add 1.7 percentage points to overall growth in the coming year," Neil Irwin reported for the Washington Post, which would put overall growth in the coming year at about 3.2% -- almost twice as strong as economic growth in 2011, the year that supplies most of these graphs' data. 

Housing is the key. And it all starts with formation.


Thursday, December 27, 2012

Forget the Fiscal Cliff!  We Will Hit the Debt Ceiling at Year-End!

All we hear about on the news is the fiscal cliff, that is revenue and spending.  But there is another half to the fiscal equation, which is the credit limit for the US or the debt ceiling. The US will hit the debt ceiling on Monday, December 31.  This is what caused so many problems in the summer of 2011, led to the "fiscal cliff" that we are currently experiencing, and led to a bond rating reduction by Standard and Poors.  Once again the Congress has lived up to one of my favorite expressions: "they never miss an opportunity to miss an opportunity".

The article is in italics and bold is my emphasis. From CNNMoney.com:

Government borrowing will hit the debt ceiling on Monday, Treasury Secretary Tim Geithner said in a letter to Congress Wednesday.

As a result, the Treasury Department will soon start using what it calls "extraordinary measures" to prevent government borrowing from exceeding the legal limit.

Such measures include suspending the reinvestment of federal workers' retirement account contributions in short-term government bonds.

On Monday, debt subject to the limit was just $95 billion below the $16.394 trillion debt ceiling.

All told, the extraordinary measures can create about $200 billion of headroom under the limit -- normally about two months worth of borrowing.

But it's unclear how much time the extraordinary measures can buy now because there are so many unanswered questions about tax and spending policies, Geithner said, referring to the lack of any resolution of the fiscal cliff.

"If left unresolved, the expiring tax provisions and automatic spending cuts, as well as the attendant delays in filing of tax returns, would have the effect of adding some additional time to the duration of the extraordinary measures," he wrote.

After the extraordinary measures run out, Treasury won't be able to pay all the country's bills in full and on time. At that point, the United States will run the very real risk that it could default on some of its obligations.

Geithner has predicted for months that the country would hit the debt ceiling by the end of December.

But Congress, first consumed with the 2012 elections and now with the fiscal cliff, has made little effort to raise the ceiling.
Now there's a good chance the debt ceiling issue won't be resolved until the 11th hour and only after an ugly fight.

Indeed, some Republicans have been saying they view the debt ceiling as leverage in budget negotiations in early 2013 in their bid to secure spending cuts.

Before fiscal cliff legislation died last week, House Speaker John Boehner offered President Obama a one-year debt ceiling increase, but only on the condition that spending cuts and reforms exceeded the size of any increase.

The last standoff over the debt ceiling in 2011 ended badly, with Congress raising it only at the last minute. The debacle led to the downgrade of the country's AAA credit rating and caused tumult in the markets.

The Government Accountability Office has long called for Congress to come up with a smarter way to handle the debt ceiling.

"Congress should consider ways to better link decisions about the debt limit with decisions about spending and revenue to avoid potential disruptions to the Treasury market and to help inform the fiscal policy debate in a timely way," the GAO said in a recent report.

Meanwhile, a variety of fiscal and monetary experts have called for the debt ceiling to be abolished altogether.

Wednesday, December 26, 2012

A Different View About What Ails the Economies of Western Europe and the US

A recent study released by the Boston Consulting Group presents a different view of the western economies and how to fix the problems.  Basically, the issues are too much debt and too much government.  The solutions are fascinating.  

The article is in italics and the bold emphasis is mine.  From the Business Insider:

If you are interested in the BSG report try BSG:
. . . . The CEO said he had been reading a new paper from Boston Consulting Group headed “ Ending the era of Ponzi finance ”. The lessons he had taken from it were miserable.
The West was not going to find its way to the right economic path with a little tweaking at the edges, the CEO said. What is needed is a wholesale overhaul of the economic system to tackle record levels of public and private debt. Was anyone brave enough to do it, he wondered aloud. . . . 
. . . . The BCG study by Daniel Stelter which is doing the rounds of corporate C-suites does not pull its punches. In fact, its punches are really just a softening-up exercise for a barrage of kicks and painful blows aimed at anyone who thinks that kicking the can down the road is a suitable substitute for radical action.
At the heart of the analysis is the issue of debt. A report by the Bank of International Settlements, the study notes, found that the combined debts of the public and private sector in the 18 core members of the OECD rose from 160pc of GDP in 1980 to 321pc in 2010.
That debt was not used to fund growth – perfectly reasonable – but was used for consumption, speculation and, increasingly, to pay interest on the previous debt as liabilities were rolled over.
As soon as asset price rises – fuelled by high levels of leverage – levelled off, the model imploded.
The issue is brought into sharp focus by one salient fact. In the 1960s, for every additional dollar of debt taken on in America there was 59c of new GDP produced. By 2000-10, this figure had fallen to 18c. Even in America, that’s about a fifth of what you’ll need to buy a McDonald’s burger.
Coupled with the huge debt burden are oversized public sectors and shrinking workforces. The larger the part the Government plays in the economy, the lower the levels of growth.
A report by Andreas Bergh and Magnus Henrekson in 2011 – cited by BCG – found that for every increase of 10pc in the size of the state, there is a reduction in GDP of between 0.5pc and 1pc. Across Europe, the average level of government spending is 40pc of GDP or higher, and is as much as 60pc in Denmark and France. In emerging markets, it is between 20pc and 40pc. This gives non-Western economies an automatic growth advantage.
This material should be gripping politicians in Westminster, not just CEOs in central London. The size of the workforce is falling across the developed world, with the United Nations estimating that between 2012 and 2050 the working-age population in Western Europe will fall by 13pc. This comes at a time when we have a pension system not much changed since the era of the man who invented it – Otto von Bismarck.
What does the West need to do to right such fundamental imbalances?
Mr Stelter and his colleagues do offer some solutions. First, there has to be an acknowledgement that some debts will never be repaid and should be restructured. Holders of the debt, be they countries or companies, should be allowed to default, whatever the short-term pain of such a process.
In social policy, retirement ages will have to increase. People will have to work harder, for longer and should be encouraged to do so by changes in benefit levels that do little – at their present level – to reward work at the margin.
The size of the state should be radically reduced and immigration encouraged. Competition in labour markets through supply-side reforms should be pursued.
Where governments can proactively act – by backing modern infrastructure – they should. High-growth economies are built on modern railways, airports, roads and energy supplies. Allowing potholes to develop in your local roads is a symptom of a wider malaise and cash-rich corporates should be pushed, through tax incentives, to invest their money in developed as well as emerging economies. Energy efficiency – to save money, not the planet – should be promoted.
As Mr Stelter says, many chief executives might understand the problem but not see it as immediately relevant to them. Profit margins across Europe have returned to the levels of 2005. Money is cheap due to the printing presses of the central banks and ultra-low interest rates. Short-term, things look OK – there has been little real pain despite the efforts of some to portray every necessary efficiency move as a “cut” of calamitous proportions.
But in the end, business needs growth in the wider economy to flourish. There needs to be a radical rethink of the way the West organises itself. Many of the ideas of Mr Stelter and his team are the right ones, although the tax burden being what it is in the UK, many would find it hard to stomach the thought of more tax rises that the BCG report recommends. At some point the relationship between taxed income and willingness to innovate turns negative.
I would suggest the UK is very near that point.
BCG’s arguments are, of course, not new. In a recent programme on the Bank of England for BBC Radio 4, I interviewed the Oxford economist, Dieter Helm. “I think it’s important to understand there are very different views about what happened in the crisis,” he told me.
“Some people think that this was some kind of Keynesian event, that our problem after the crash was deficient demand and therefore what we had to do was stimulate the economy.
“In other words, where we were in 2006 in terms of our consumption and spending was perfectly sustainable.
“[But] what’s going on is a massive postponement exercise and I think that means that the sustainable level of consumption we will end up with will be lower than it would have been if we’d faced up to the reality of our economic mess that was created by the great boom of the 20th century and the enormous splurge of spending and asset bubble of the early years of the 21st century.”  . . . . 


The 2012 Shopping Season Was Weak with Only an Increase of 0.7% Over Last Year
2012 was a tough holiday season for retailers.  The article is in italics, the bold is my emphasis.  From the Business Insider:
U.S. holiday retail sales this year grew at the weakest pace since 2008, when the nation was in a deep recession. In 2012, the shopping season was disrupted by bad weather and consumers' rising uncertainty about the economy.
A report that tracks spending on popular holiday goods, the MasterCard Advisors SpendingPulse, said Tuesday that sales in the two months before Christmas increased 0.7 percent, compared with last year. Many analysts had expected holiday sales to grow 3 to 4 percent.
In 2008, sales declined by between 2 percent and 4 percent as the financial crisis that crested that fall dragged the economy into recession. Last year, by contrast, retail sales in November and December rose between 4 percent and 5 percent, according to ShopperTrak, a separate market research firm. A 4 percent increase is considered a healthy season.
Shoppers were buffeted this year by a string of events that made them less likely to spend: Superstorm Sandy and other bad weather, the distraction of the presidential election and grief about the massacre of schoolchildren in Newtown, Conn. The numbers also show how Washington's current budget impasse is trickling down to Main Street and unsettling consumers. If Americans remain reluctant to spend, analysts say, economic growth could falter next year.
In the end, even steep last-minute discounts weren't enough to get people into stores, said Marshal Cohen, chief research analyst at the market research firm NPD Inc.
"A lot of the Christmas spirit was left behind way back in Black Friday weekend," Cohen said, referring to the traditional retail rush the day after Thanksgiving. "We had one reason after another for consumers to say, 'I'm going to stick to my list and not go beyond it.'"
Holiday sales are a crucial indicator of the economy's strength. November and December account for up to 40 percent of annual sales for many retailers. If those sales don't materialize, stores are forced to offer steeper discounts. That's a boon for shoppers, but it cuts into stores' profits. . . . . 
 . . . . Spending by consumers accounts for 70 percent of overall economic activity, so the eight-week period encompassed by the SpendingPulse data is seen as a critical time not just for retailers but for manufacturers, wholesalers and companies at every other point along the supply chain.
The SpendingPulse data include sales by retailers in key holiday spending categories such as electronics, clothing, jewelry, luxury goods, furniture and other home goods between Oct. 28 and Dec. 24. They include sales across all payment methods, including cards, cash and checks.
It's the first major snapshot of retail sales during the holiday season through Christmas Eve. A clearer picture will emerge next week as retailers like Macy's and Target report revenue from stores open for at least a year. That sales measure is widely watched in the retail industry because it excludes revenue from stores that recently opened or closed, which can be volatile.
Despite the weak numbers out Tuesday, retailers still have some time to make up lost ground. The final week of December accounts for about 15 percent of the month's sales, said Michael McNamara, vice president for research and analysis at MasterCard Advisors SpendingPulse. As stores offer steeper discounts to clear some of their unsold inventory, they may be able to soften some of the grim results reflected in Tuesday's data.
Still, this season's weak sales could have repercussions for 2013, he said. Retailers will make fewer orders to restock their shelves, and discounts will hurt their profitability. Wholesalers, in turn, will buy fewer goods, and orders to factories for consumer goods will likely drop in the coming months.
In the run-up to Christmas, analysts blamed the weather and worries about the "fiscal cliff" for putting a damper on shopping. Superstorm Sandy battered the Northeast and mid-Atlantic states in late October. Many in the New York region were left without power, and people farther inland were buried under feet of snow. According to McNamara, the Northeast and mid-Atlantic account for 24 percent of U.S. retail sales.
Buying picked up in the second half of November as retailers offered more discounts and shoppers waylaid by the storm finally made it into malls, he said.
But as the weather calmed, the threat of the "fiscal cliff" picked up. In December, lawmakers remained unable to reach a deal that would prevent tax increases and government spending cuts set to take effect at the beginning of 2013. If the cuts and tax hikes kick in and stay in place for months, many economists expect the nation could fall back into recession.
The news media discussed this possibility more intensely as December wore on, making Americans increasingly aware of the economic troubles they might face if Washington is unable to resolve the impasse. Sales never fully recovered, Cohen said.
The results were weakest in areas affected by Sandy and a more recent winter storm in the Midwest. Sales declined by 3.9 percent in the mid-Atlantic and 1.4 percent in the Northeast compared with last year. They rose 0.9 percent in the north central part of the country.
The West and South posted gains of between 2 percent and 3 percent, still weaker than the 3 percent to 4 percent increases expected by many retail analysts.
Online sales, typically a bright spot, grew only 8.4 percent from Oct. 28 through Saturday, according to SpendingPulse. That's a dramatic slowdown from the online sales growth of 15 to 17 percent seen in the prior 18-month period, according to the data service.
Online sales did enjoy a modest boost after the recent snowstorm that hit the Midwest, McNamara said. Online sales make up about 10 percent of total holiday business.


The Fiscal Cliff and the Cult of Deficit and Interest Rate

I usually do not include comments from Paul Krugman in my blog, but recently he has had a series of comments about the fiscal cliff, the deficit, and interest rates that I found interesting.  Mostly, that the concerns about the deficit, interest rates, and deficit are misguided.  Should we be concerned about about the deficit, national debt, interest rates, etc, of course.  Are all the dire events predicted - probably not.  Go back and read the financial history of the late 1940s and the 1950s to gain some perspective on how the US handled the deficit and large amounts of national debt in the past.

The article is in italics.  From the NY Times: 

Back in the 1950s three social psychologists joined a cult that was predicting the imminent end of the world. Their purpose was to observe the cultists’ response when the world did not, in fact, end on schedule. What they discovered, and described in their classic book, “When Prophecy Fails,” is that the irrefutable failure of a prophecy does not cause true believers — people who have committed themselves to a belief both emotionally and by their life choices — to reconsider. On the contrary, they become even more fervent, and proselytize even harder.
This insight seems highly relevant as 2012 draws to a close. After all, a lot of people came to believe that we were on the brink of catastrophe — and these views were given extraordinary reach by the mass media. As it turned out, of course, the predicted catastrophe failed to materialize. But we can be sure that the cultists won’t admit to having been wrong. No, the people who told us that a fiscal crisis was imminent will just keep at it, more convinced than ever.
Oh, wait a second — did you think I was talking about the Mayan calendar thing?
Seriously, at every stage of our ongoing economic crisis — and in particular, every time anyone has suggested actually trying to do something about mass unemployment — a chorus of voices has warned that unless we bring down budget deficits now now now, financial markets will turn on America, driving interest rates sky-high. And these prophecies of doom have had a powerful effect on our economic discourse.
Thus, back in May 2009 the Wall Street Journal editorial page seized on an uptick in long-term interest rates to declare that the “bond vigilantes,” the “disciplinarians of U.S. policy makers,” had arrived, and would push rates inexorably higher if big budget deficits continued. As it happened, rates soon went back down. But that didn’t stop The Journal’s news section from rolling out the same story the next time rates rose: “Debt fears send rates up,” blared a headline in March 2010; the debt continued to grow, but the rates went down again.
At this point the yield on the benchmark 10-year bond is less than half what it was when that 2009 editorial was published. But don’t expect any rethinking on The Journal’s part.
Now, you could say that The Journal’s editors didn’t give a specific date for the fiscal apocalypse, although I doubt that any of their readers imagined that they were talking about an event at least three years and seven months in the future.
In any case, some of the most prominent deficit scolds have indeed been willing to talk about dates, or at least time horizons. In early 2011 Erskine Bowles confidently declared that we would face a fiscal crisis within around two years unless something like the Bowles-Simpson deficit plan was enacted, and Alan Simpson chimed in to say that it would be less than two years. I guess he has about 10 weeks left. But again, don’t expect either Mr. Simpson or Mr. Bowles to admit that there might have been something fundamentally wrong with their analysis.
No, very few of the prophets of fiscal doom have acknowledged the failure of their prophecies to come true so far. And those who have admitted surprise seem more annoyed than chastened. For example, back in 2010 Alan Greenspan — who is, for some reason, still treated as an authority figure — conceded that despite large budget deficits, “inflation and long-term interest rates, the typical symptoms of fiscal excess, have remained remarkably subdued.” But he went on to declare, “This is regrettable, because it is fostering a sense of complacency.” How dare reality not validate my fears!
Regular readers know that I and other economists argued from the beginning that these dire warnings of fiscal catastrophe were all wrong, that budget deficits won’t cause soaring interest rates as long as the economy is depressed — and that the biggest risk to the economy is that we might try to slash the deficit too soon. And surely that point of view has been strongly validated by events.
The key thing we need to understand, however, is that the prophets of fiscal disaster, no matter how respectable they may seem, are at this point effectively members of a doomsday cult. They are emotionally and professionally committed to the belief that fiscal crisis lurks just around the corner, and they will hold to their belief no matter how many corners we turn without encountering that crisis.
So we cannot and will not persuade these people to reconsider their views in the light of the evidence. All we can do is stop paying attention. It’s going to be difficult, because many members of the deficit cult seem highly respectable. But they’ve been hugely, absurdly wrong for years on end, and it’s time to stop taking them seriously.

Saturday, December 22, 2012


The Fiscal Cliff - The Most Mature Thing I Have Read in Awhile

Personally, I am not seriously concerned about the fiscal cliff.  It is a waste of time.  I cannot effect the outcome in Washington.  Regardless of the outcome it will not ruin my life, after all the sun will rise on January 2.  I would prefer if taxes did not go up, but we are not going to grow our way out of our national debt.  There are going to be tax increases.  

When it comes to investing I am only concerned about how much money I am going to make and seldom am I worried about the taxes.  I am aware of the tax consequences of a decision, but it seldom alters my path.  All this talk about the fiscal cliff is to sell newspapers and to keep people watching TV and listening to talk radio.

The article is in italics and the bold/colors is my emphasis.  From Market Riders:

By the way, if you are interested in some serious and rational talk about investments I strongly urged you to visit the Market Riders website.  

If you’ve been following the news lately, it’s hard to avoid the constant drip-drip-drip of headlines about the supposed crisis of the “fiscal cliff.” Yet serious investors should ignore the fiscal cliff.

Until the horror of the school shooting displaced it, cliff chatter was the entire news cycle. As we attempt to gather our senses following the shock of what happened in Connecticut, you still see the cliff story poking its unwelcome nose back in.

President Obama looks strangely jovial while sitting at a table with the Republican speaker, Rep. John Boehner. Minutes later, Boehner is standing uncomfortably at a mic, delivering his lines on cue and promising an answer but arguing that the White House is intransigent. Twenty-four hours later, they do it again.

Meanwhile, the clock ticks: On Jan. 1, taxes will rise nearly vertically and on nearly everyone. Government spending, including defense, will get bashed right in the nose to the tune of $1.2 trillion in automatic cuts.

That’s the “cliff” part. Economists have been warning for months that the shock of higher taxes across the board, including on the middle class, along with a sudden drop in government-related spending will push the economy into a slowdown, if not a recession.

Financial cable TV shows won’t let us ignore the fiscal cliff. They’ve taken to putting a countdown clock on the screen. The amount of ink spilled on the subject has been voluminous. You’re probably numb by now. Resigned. Ready to throw in the towel, sell your investments, maybe invest in a good solid safe for your home.

Put down the remote. Now walk away from the television. It’s time to ignore the fiscal cliff.

Chances are, if you are in your 40s or 50s, you do not have plans to retire on Jan. 2. If you are exactly 65 this month, well, congratulations! The good news is, the CDC projects that you will live another 19 years or so. Some of us will leave this Earth earlier, some later, but the idea that you won’t see 80-plus is way off the mark. You probably will.

Which means that, even as a newly minted retiree, you need your money to grow and grow safely for years to come. Now is no time to bail out on investing for the long run.

Paul J. Lim at The New York Times wrote recently on the subject of market forecasting. The summary version is simple: Nobody can do it. One-year forecasts are pretty much worthless (witness the past year, which saw stocks zoom into the teeth of a weak, slow recovery), and even decade-out estimates are close to garbage.

Long-term price-to-earnings (P/E) ratios used by Yale professor Robert Shiller, Lim writes, explain just 43 percent of stock returns. The balance can’t be explained by valuations, he writes, quoting a senior economist at the Vanguard Group, Roger Aliaga-Díaz.

The takeaway for investors with more than a five-minute attention span is pretty simple. If the economy doesn’t drive stock performance and valuations cannot explain it, either, then following the crisis-of-the-moment out of the Beltway, from the media or touted by your broker is plain nuts. You can and should ignore the fiscal cliff.

Does that mean that spending and taxes don’t matter? Of course they do. That the economy is immune to the fiscal cliff outcome? Absolutely not.

But it does mean that your risk from overreacting to headlines is probably the most dangerous part of the news cycle, such as it is. A properly balanced portfolio can withstand declines and, in fact, offers you opportunities to reinvest in an automated, disciplined way.  And that is far more important to your own bottom line five or 10 years down the road.

Thursday, December 20, 2012

TARP is Close to Break-Even

Believe what you like concerning whether or not the Congress should have passed the TARP legislation.  TARP did help stabilize the major banks in the US, allowed the auto industry (GM and Chrysler) to restructure during a bankruptcy, and it saved AIG.  It saved a lot of jobs, a great deal of financial pain, and probably stymied the the possibility of another Great Depression.  And the best part is that the US Treasury will probably at least break-even in the process.  Wow TARP limited the pain and in the final analysis did not cost us anything.  Sounds like a good deal to me.

The article is in italics.  From CNN Money:

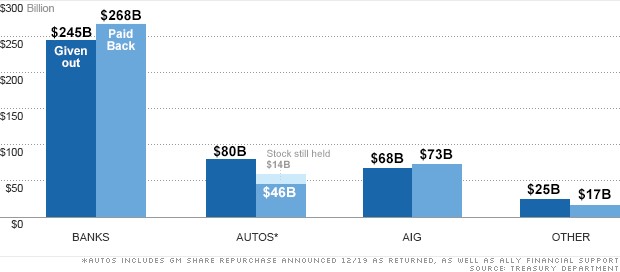
The TARP bailout fund, which pumped nearly $500 billion into the nation's leading banks, automakers and insurers, is getting closer to the break-even point.

The big banks had already paid back their loans, and last week, the Treasury Department sold its remaining stake in AIG. On Wednesday, General Motors said it was buying back 200 million shares from the government. Bailed-out companies had also paid nearly $43 billion in dividends and interest over the past four years.
That leaves a loss of just under $14 billion, including $6 billion for programs to prevent foreclosure that were never meant to be paid back.
The shares of banks and automakers that Treasury still owns is likely to fetch close to that much, if not more.
For example, Treasury will still own 300 million shares of GM stock that it plans to sell during the next 15 months. At current prices, the stake alone is worth more than $8 billion.
The Treasury also owns a 74% stake in Ally Financial, as well as $5.9 billion in preferred shares. While the exact value of those holdings isn't known because Ally shares are not publicly traded, the holdings could easily top the $6 billion gap still remaining after GM.
Though Treasury no longer owns shares in the nation's biggest banks, it still holds stakes in 213 small banks that have been unable to raise the capital they need to repay taxpayers. Treasury expects to sell its holdings in about two-thirds of those banks in 2013.
Not everyone thinks TARP should be counted as this close to break-even. One issue is how to count dividends and interest. The Special Inspector General for TARP does not include them, arguing those payments were owed for use of the bailout funds.
The TARP watchdog also doesn't count $17.6 billion from the sale of AIG shares that Treasury got from the Federal Reserve.
Neil Barofsky, the original Special Inspector General and a critic of the bailout, acknowledges that a lot of money has been paid back. "I'm pretty agnostic as to what should be counted [as a profit or loss]," he said. "But it seems like under almost any of the official estimates, the loss will be much smaller than anyone thought in 2009."
Even so, he argues the bailout failed at its mission of getting banks to loan out money they received, and helping to stabilize the battered housing market.
Even if taxpayers break even on TARP, it wasn't the only bailout to consider.
The largest was $187.5 billion for mortgage finance firms Fannie Mae and Freddie Mac. Even with the $50.5 billion in dividends, taxpayers are still out $137 billion from that rescue.