US Housing Starts Through May 2014
US housing starts both total and 1-unit structures from January 1959 through May 2014. Note the spread between total and 1-unit structures for the last few years.
From the St. Louis Federal Reserve Bank:
Thursday, July 10, 2014
Wednesday, July 9, 2014
Karl Case of the Case-Shiller Index Comments About Housing.
Continuing the topic of housing from the previous 2 posts, below are comments made about the housing market from Karl Case of Case-Shiller Index fame. It is fair to say that he sees difficult times ahead in the housing market.
The article is in italics and the bold is my emphasis. From CNN Money:
Continuing the topic of housing from the previous 2 posts, below are comments made about the housing market from Karl Case of Case-Shiller Index fame. It is fair to say that he sees difficult times ahead in the housing market.
The article is in italics and the bold is my emphasis. From CNN Money:
The housing market is a "crapshoot" now, according to one of America's leading real estate experts.
Karl "Chip" Case is an economist whose name is synonymous with home prices. He is co-creator of the much watched S&P/Case-Shiller home price indexes with Bob Shiller, who won the Nobel Prize in economics last year.
"You've got much more negative vibrations in the housing surveys about homeownership than we ever had before," Case told CNNMoney. "I think it's because people got hosed. They thought that housing prices will never go down. That's just bull -- you know what."
At age 67, Case still rattles off housing data with the kind of enthusiasm that most people use to recite popular song lyrics. For Case, the key metric to watch is housing starts, a measure of new residential home construction.
The housing starts figures have been "unbelievably regular" for 50 years, oscillating between a million a month in not so great times and two million during peak economic times.
"Every time it's gotten below a million in the past, it's come right back," Case says. Every time except the Great Recession.
Housing starts fell below 500,000 for several months in 2009, an unthinkable level. And they have been slow to rebound. They finally eked above the million mark in April, but it's unclear to Case if this is a true turning point.
He calls the real estate market "segmented" these days. It's no longer a guarantee that housing prices will go up across the country. That only happens in some places at some times.
The demand side of the equation will also be key. Will millennials actually purchase homes? Will foreign buyers keep coming?
"The Chinese are coming over here with millions and billions of dollars, and they want to spend it on assets that tend to hold their value. And at least the theory is that housing does. But it is far from what it was in 2004," Case notes.
The advice Case gives to first-time homebuyers is familiar to most. Be sure you can afford the house and don't expect a quick profit.
"If you're not buying it for the long haul, don't buy because there's a good chance you'll have to sit through some down cycles. But when it goes, it's very nice," he says.
Case has studied housing extensively. But he's not just an academic. He's a homeowner too. He still remembers the house he bought in 1976 for $54,000 and sold years later for $240,000. Another home in the Boston area he purchased for about $375,000 is now worth a million.
But even Case doesn't always call housing trends correctly, at least in the short-term. He estimates that another property he owns lost close to half its value in the downturn. For now, he's keeping it.
Tuesday, July 8, 2014
The Housing Market is Faltering #2
Below is another recent article about the faltering housing market. This author points out that the interest in home ownership is being usurped by concerns for having enough money for retirement, not to mention all the other things such as lending standards, etc. One thing I have noticed in the younger generation (mostly millennials) is that they do not consider home ownership as an investment. A very different view from earlier generations.
The article is in italics and the bold is my emphasis. From Market Watch:
For Rebecca Diamond, a marketing manager in Randallstown, Md. who’s getting married this month, buying a home with her new husband would seem like the logical next step.
But she’s not even considering it.
“No interest whatsoever. I don’t want the cost and responsibility of one right now,” she says. “Let [the landlord] have all the headaches,” adds Diamond, who rents a three-bedroom condo outside of Baltimore.
She’s hardly alone. Just 74.4 million American households — less than 65% of the country — owned the homes they lived in during the first quarter of this year, according to a U.S. Census Bureau report this week. That was the lowest level since 1995 and a big drop from 2006, when a peak of 76.5 million households, or 68.9%, were owner-occupied.
In fact, the National Endowment for Financial Education released a poll this week that showed only 13% of Americans considered home ownership as their “top long term financial goal,” down from 17% in 2011.
“The American dream has long been associated with the gratification and security of a comfortable home within the picturesque borders of a white-picket fence,” said Ted Beck, president and CEO of the NEFE, which is based in Denver. “However, today the perceived importance of home ownership appears to be waning.”
Instead, according to the poll, a whopping 50% said that their sole long term financial goal was to save enough for retirement, up from 43% three years earlier, even though most financial planners say owning a home is the best way to build wealth that can be tapped once you retire.
Stephen Alberts, a Long & Foster real-estate agent in Williamsburg, Va., who does many of his deals in the coastal retirement community of Virginia Beach, says his business is tougher than ever. “Even I’ve got to pound the ground,” he said. “Buyers just aren’t coming to me anymore.”
For him, it’s all about the economy.
“In most markets they’re worried about the security of their jobs, so they’re reluctant to put roots down and get stability.” Alberts says his market generally bucks the trend since Virginia Beach is a destination for many to spend their golden years. “We are more stable as we have retirees who have already made their money,” echoing NEFE’s poll numbers showing retirement savings is driving consumers.
Still, Albert says first-time home buyers are put off by rising prices and multiple bids. “We also have to do a lot of re-education of our buyers,” he said.
For realtors too, it’s credit scores being too tight.
According to the National Association of Realtors, the average accepted credit score on conventional mortgages was around 720. “A credit score that would have gotten you a mortgage before 2008 is now below the average rejection score,” said Walt Molony of the National Association of Realtors.
“Things are improving, but at a snail’s pace,” he said. The NAR points to its “Housing Affordability Index,” which shows that if a U.S. family was earning the median family income in 2013 of $63,623, it would have 175% of the necessary income to buy a median single family home priced at $197,400.
That equates to about 20 million households able to purchase a home, but choosing not to. And Molony points the finger at the banks more than anything else. “The problem is overly restrictive mortgage lending standards, relying on arbitrarily high credit scores,” he said.
That’s not necessarily true, said Darren Ferlisi, a loan officer with Integrity Home Mortgage Corp. in Frederick, Md., who said FICO scores of 640 and in some cases as low as 620 will qualify for a mortgage today. “If anything, we have more flexibility than we had two years ago,” he said.
Still, as a result of the Great Recession, many people who otherwise had 9-to-5 jobs now are freelancers or self employed, which makes proving two years’ worth of income difficult, especially when those first two years were poor ones as their businesses were just getting off the ground, says Greg McBride, chief financial analyst at Bankrate.com.
“The problem is a lot of those people don’t have $20,000 or $30,000 to make a down payment, and if they’ve got two years of tax returns, in this economy, they might be losses,” McBride said. “A loss for tax purposes is still a loss when it comes to qualifying for a home mortgage.”
McBride says he sees the smaller number of Americans making a home their ultimate financial goal as a good thing. “People compromise their financial goals in pursuit of home ownership and they aren’t putting enough into their retirement or their 401(k) and they end up house rich but cash poor,” he said.
Once more Americans feel financially secure about their retirement, they’ll return to the housing market, he said. “They’ve rightly felt burned by the housing bust, but five to fifteen years from now, they’ll be back.”
Monday, July 7, 2014
The Housing Market is Faltering
There are so many problems with the US housing market that I cannot even begin to discuss them. But, the simplest way to understand the real estate market is that the US has the lowest mortgage rates since the Eisenhower Administration and the housing market is stagnating. We have a problem. The article below outlines some of the issues in the current real estate market. Also please remember that real estate markets are local. What applies in Oakland, CA may not apply in Oakland, MI.
From Bloomberg:
The two-year-old U.S. housing recovery is faltering.
The Mortgage Bankers Association yesterday lowered its forecast for combined new and existing home sales in 2014 to 5.28 million -- a decline of 4.1 percent that would be the first annual drop in four years. The group also cut its prediction on mortgage lending volume for purchases to $595 billion, an 8.7 percent decrease and the first retreat in three years.
Bullish forecasts in early 2014 from MBA, Fannie Mae, and Freddie Mac have been sideswiped by rising home prices and an economy that isn’t producing higher paying jobs. The share of Americans who said they planned to buy a home in the next six months plunged to 4.9 percent last month from 7.4 percent at the end of 2013, the highest in records going back to 1964, according to the Conference Board, a research firm in New York.
“The big housing rally wiped itself out because prices increased too quickly for buyers to keep up,” said Richard Hastings, a consumer strategist at Global Hunter Securities LLC in Charlette, NC, who predicted the slowdown eight months ago. “The pool of eligible new buyers is collapsing” because of stagnant incomes and lack of credit, he said.
The best-qualified homebuyers jumped into the market last year to grab near-record low mortgage rates that averaged about 3.5 percent after delaying their moving plans during the housing slump, said Nariman Behravesh, chief economist of IHS Inc., a research firm based in Englewood, Colorado.
The median price of an existing home gained 11.5 percent last year, second only to 2005’s 12 percent increase, the highest on record, according to the National Association of Realtors. This year, price appreciation probably will slow to 5.6 percent, NAR said. U.S. 30-year fixed mortgage rates probably will average 4.5 percent, up from 4 percent last year, according to the MBA forecast.
As prices climb, the ability of Americans with stagnant wages to buy homes wanes.
The median U.S. household income rose less than 1 percent in 2013, according to data from Sentier Research LLC in Annapolis, Maryland. In April, the median income was $52,959. When adjusted for inflation, that’s almost 6 percent lower than in June 2009, which marked the beginning of the economic recovery, said Gordon Green, a Sentier partner who formerly directed the Census Bureau office that compiles wage statistics.
“Even though we’re technically in a recovery, household income is lower now than it was in the recession,” Green said. “It makes it a lot harder to buy a house.”
Three major housing forecasters -- MBA and government-run mortgage financiers Freddie Mac and Fannie Mae -- began the year projecting an average home-sale gain of 10 percent in 2014.
In May, after monthly reductions in their estimates, Fannie Mae and MBA for the first time projected an annual decline, amounting to less than one percent.
Freddie Mac this week lowered its 2014 home sales forecast to 5.4 million -- a 1.8 percent drop from 2013. The company also cut its prediction on mortgage lending volume for purchases to about $751 billion.
While home purchase applications have picked up recently with the traditional home buying season now underway, they’re still 13 percent below last year, Freddie Mac chief economist Frank Nothaft and deputy chief economist Leonard Kiefer said in the forecast.
“For this reason, we’re lowering our overall homes sales forecast” for 2014, the economists said.
Next year, new and existing home sales probably will increase to 5.8 million, according to the forecast.
The pullback by the largest investors, who raised about $20 billion to purchase as many as 200,000 properties in the past two years, has also cooled the market.
With home prices up 31 percent since a post-bubble low in January 2012 and bargains harder to find, Blackstone Group LP has reduced its pace of buying by 70 percent since last year. The firm is focusing its acquisitions for rentals on five markets -- Seattle, Atlanta and the Florida cities of Tampa, Orlando and Miami, Jonathan Gray, the firm’s global head of real estate, said in March.
As signs of a housing slowdown appeared early this year, economists initially blamed severe weather. The winter was the coldest in four years and some U.S. cities had snow accumulations at near-record levels, according to Commodity Weather Group LLC in Bethesda, Maryland.
“Winter weather explanations are valid, but they’re not endless,” said Hastings of Global Hunter. “When prices go up too much in an environment where families can’t pay them, the rally cancels itself out.”
The economy, which contracted 1 percent in the first quarter, is mostly generating lower-paying jobs.
In May, payrolls increased by more than 200,000 for a fourth consecutive month, the first time that’s happened since early 2000, according to the Labor Department. The number of workers in May rose to 138.5 million, surpassing the level in 2008 before the financial crisis wiped out 8.7 million jobs.
The gain was led by low-paying positions such as nursing home orderlies and temporary office jobs, both at records, according to government data.
Even with job increases, “a broader assessment of indicators suggests that underutilization in the labor market remains significant,” Federal Reserve Chair Janet Yellen said at a June 18 press conference in Washington following a meeting of the FOMC.
High-wage sectors haven’t rebounded. Compared with 2008, there were 1.6 million fewer people working in manufacturing in May and 340,000 fewer people working in finance, according to government data.
“The real shocker is the labor market,” said Behravesh of IHS. “We’re barely back up to where we were before the recession began. A lot of the people without good jobs are the ones who should be buying homes right now.”
Even with mortgage rates that have averaged 4.3 percent this year, housing affordability has eroded. In the first quarter, 66 percent of new and existing homes were affordable to families earning the national median income, down from 74 percent a year earlier, according to the National Association of Home Builders in Washington.
Economic grow this year would create additional jobs and allow more people to buy homes. The pace of growth will exceed 3 percent in the final three quarters of the year, according to economists surveyed by Bloomberg.
The FHFA, which oversees Freddie Mac and Fannie Mae, in May announced new rules to encourage lenders to relax credit standards. The rules are designed to reduce the risk that lenders will have to buy back soured mortgages due to underwriting errors -- an issue that has kept standards tight.
The average credit score for borrowers in May who bought homes was 755 on a scale of 300 to 850, according to a report this week from Ellie Mae, a loan processor in Pleasanton, California. That compared with 756 in December, the last time it was higher.
A decade ago before the housing bubble, the average score was about 715, said Mark Zandi, chief economist at Moody’s Analytics Inc. in West Chester, PA.
“Making credit more available is vital to the housing recovery, which is vital to the economy,” said Zandi.
Sunday, July 6, 2014
Which Should We Measure GDP or Happiness?
It is Sunday and it is time to contemplate the world in which we live. The article below is about "what is happiness", how should it be measured, how should be compared to GDP, etc. All good questions.
The article is in italics and the bold is my emphasis. From CNN Money:
The drafters of the Declaration of Independence didn't really define "Happiness" when they cited the pursuit of it as an inalienable right.
But in recent years, there's been a quest to define and measure it, especially in the context of a prosperous economy.
That's because economic growth as measured by gross domestic product doesn't really tell us much about citizens' general well-being.
"For example, traffic jams may increase GDP as a result of the increased use of gasoline, but obviously not the quality of life," according to a report by an international commission chaired by Nobel Prize-winning economist Joseph Stiglitz.
The assumption is that the more economic growth the better. Legislators are forever debating the merits of a measure on the basis of whether it would create jobs and boost GDP.
But rarely do you hear lawmakers debate whether a measure will boost or detract from citizens' well-being, of which income is just on part.
Take North Dakota. Its economy has doubled in the past 25 years thanks to a massive oil boom. Incomes have soared, but so have prices, traffic, crime, and housing shortages.
Well-being, of course, relies on many factors -- from health and education, to environment and culture, to the quality of governance, your community and how you use your time.
There's a growing international chorus that thinks this kind of well-being should be measured and used as a guide when formulating policy and tracking social progress.
The tiny nation of Bhutan pioneered the effort, adopting a "gross national happiness index" decades ago. (BTW, Bhutan is in the Himalayas north of Bangladesh and east of Nepal. I had to look it up.)
The rest of the world has been slow to catch on. But there have been nascent efforts in recent years to address the issue.
In 2011, the U.N. General Assembly passed a resolution encouraging countries to measure their citizens' happiness and use that measure to help guide public policies.
More recently, the Organization for Economic Cooperation and Development (OECD) has created guidelines for nations that want to measure well-being.
In the United States, four states -- Maryland, Vermont, Oregon and Colorado -- have developed a "genuine progress indicator," according to Demos, a left-leaning think tank.
The GPI seeks to quantify in a consistent way the cost and value of factors not measured by GDP.
For instance, Maryland -- which was the first state to adopt a GPI -- is seeking to assess, among other things, the "environmental and social costs of what we buy, [and] the quality-of-life impacts of how we live."
Some cities and towns, meanwhile, have started their own "happiness initiatives," distributing gross happiness surveys to residents to give local policymakers a sense of the level of their constituents satisfaction in different areas.
It doesn't appear that there will be any kind of universal agreement to measure citizens' happiness and well-being anytime soon.
But proponents -- such as the Sustainable Development Solutions Network (SDSN) -- are trying to make the economic case to governments as to why they should.
"Happy people live longer, are more productive, earn more, and are also better citizens. Well-being should be developed both for its own sake and for its side-effects," SDSN noted in its 2013 World Happiness Report.
Other sources on this subject:
Joseph Stiglitz analysis:
http://www.stiglitz-sen-fitoussi.fr/documents/rapport_anglais.pdf
Bhutan guide to Gross National Happiness Index:
http://www.grossnationalhappiness.com/wp-content/uploads/2012/04/Short-GNH-Index-edited.pdf
Want to take the Gross National Happiness Index? Well worth the time. I need to become happier.
http://www.happycounts.org/
The World Happiness Report:
http://unsdsn.org/wp-content/uploads/2014/02/WorldHappinessReport2013_online.pdf
The World Happiness Report:
http://unsdsn.org/wp-content/uploads/2014/02/WorldHappinessReport2013_online.pdf
Sunday, June 22, 2014
Who Pays the Taxes?
I am always fascinated by who pays the taxes in the US. I am fascinated because there is a great deal of 100% fact-free discussion about a subject in the mainstream media and among the politicians in spite of fact that there is a great deal of data available on the subject. So let's skip all the discussion and go right to the data.
By the way, do not infer any point of view on my part due the charts or their sources. I just like the charts.
From Heritage Org:.
Despite the top individual tax rate fluctuating between 91 percent and 28 percent over the past 50 years, total individual receipts have remained fairly stable. The top rate was last increased in 2013 and is now at 39.6 percent.
A second graph I found interesting from The Daily Signal:
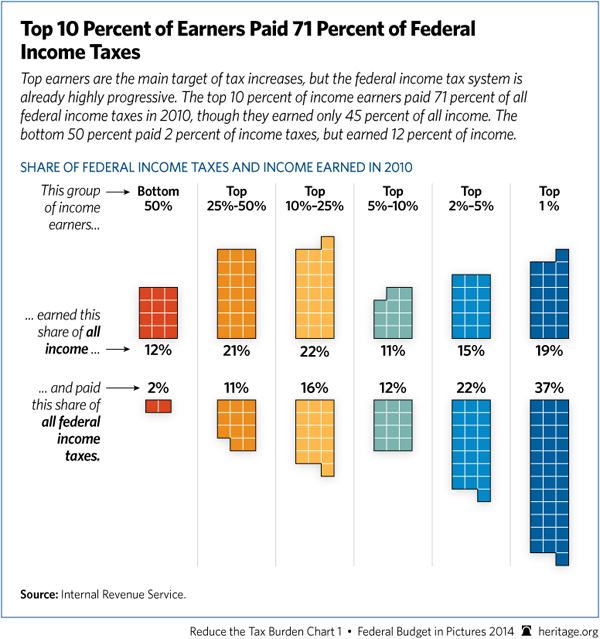
Despite calls for more taxes on the rich, the Heritage chart shown above reveals that the recent tax increases disproportionately affect the working wealthy. The top 10 percent of all income earners paid 71 percent of federal income taxes in 2010, yet they earned 45 percent of all federal income. Compare that to the bottom 50 percent of earners, who earn 12 percent of income yet pay only 2 percent of federal income taxes.
Saturday, June 21, 2014
Should You Be Buying into the Rally in Gold Prices?
In recent weeks the price of gold has move up nearly 6%. Is this a harbinger of more gains in the future. I do not think so. Precious metal prices are driven by uncertainty and/or inflation. Maybe gold is up recently due in the situation in the Ukraine or in Iraq, but inflation fears are probably misguided. When you put all those things together I am not seeing any strong drivers for higher gold prices.
Below is an article from CNN Money.com concerning the recent run-up in the price of gold.
Gold shot up more than 3% on Thursday, the biggest one day gain since September 2013. Prices were up slightly again Friday, with futures trading at about $1,316 an ounce.
So far this month, gold prices have risen nearly 6%.
While gold bugs have regained some swagger, analysts don't expect the metal to break out of the funk it's been in for the past year.
The recent jump in gold prices comes as turmoil in Iraq has put some investors on edge. Gold and other so-called "hard" assets often find favor in times of political and economic uncertainty.
Meanwhile, Russian forces have been massing on the eastern border with Ukraine, raising concerns about an escalation of tensions in an already volatile region.
"There are a lot of reasons investors should own gold," said Donald Doyle, chief executive of Blanchard & Co., a precious metals dealer in New Orleans. The current geopolitical uncertainty "illustrates the metal's qualities as insurance when governments clash."
Doyle added that investors were also spooked by comments from Janet Yellen on Wednesday. Yellen reiterated that the central bank is unlikely to hike interest rates any time soon.
Some investors see gold as an alternative to the U.S. dollar, which they believe is being undermined by the Fed's policies.
But other analysts say Thursday's rally was driven by technical factors, such as "short covering."
The price of gold rose above its 50-day moving average early Thursday, which triggered a wave of buy orders and caused investors who were betting against the metal to unwind their positions, said Carlos Sanchez, a precious metals analyst at the CPM Group.
Investors have been "short" gold for at least a year, meaning they are positioned to benefit from falling prices. Analysts say that's not likely to change anytime soon.
The summer months are historically very slow in the gold market. In addition, demand from China, which has been a big consumer of physical gold, is slowing down.
While geopolitical concerns could help support the metal in the short term, "I still think gold is headed lower," said Sanchez.
And despite worries about Ukraine and Iraq, investors don't appear to be that scared. The VIX, a key measure of volatility, is at its lowest point since 2007. And the CNNMoney Fear & Greed Index, which looks at the VIX and six other measures of investor sentiment, is showing signs of Extreme Greed.
Investors fled the gold market last year as they chased better returns in more risky assets. Gold prices fell nearly 30% in 2013. It was the biggest decline since 1981 and the first year-over-year drop since 2000.
Gold hit an all-time high near $1,900 an ounce in 2011, as investors worried about a global economic collapse. But the metal has fallen out of favor with stocks in the midst of a five year-old bull market.
"The fact that the equity market continues to be strong doesn't give traders much incentive to get into gold," said Rob Kurzatkowski, senior commodities analyst at optionsXpress.
Gold will probably continue to trade in the range it has been in for most of the year, between $1,200 and $1,300 an ounce, Kurzatkowski added.
"Gold may just continue to grind here," he said. "There are too many factors underpinning the market for gold to collapse, but there's not enough to spark the metal higher either."
Wednesday, June 18, 2014
The Stock Market- "It is Not Different This Time" - "It is the Same This Time"
Below is an article from Steve Hassett at Seeking Alpha. It is a short description of Steve's view of the stock market and the fact that currently "nothing is new it, it is the same old stuff". Steve has a relatively simple model of the stock market the Risk Premium Factor and he has fairly good luck predicting future price of the S&P 500.
By the way, for those of you who do not peruse Seeking Alpha from time to time you are missing an excellent resource on investing, finance, and economics. Is everything you see on the site good - no, of course not. But there is a lot of really good analysis on this site.
S&P Fairly Valued Because 'It's The Same This Time'
Summary
- Room to grow. Despite the exceeding the post-war average for economic recoveries, U.S. employment has only just matched the previous peak.
- Record highs are not rare and not indicative of a bubble. Since 1960, the S&P 500 Index has hit a new closing high over 800 times.
- It's not different this time. The market has been valued based on the same predictable factors since at least 1960.
Some argue that we are in an unusually strong or long recovery for the stock market and the overall economy.
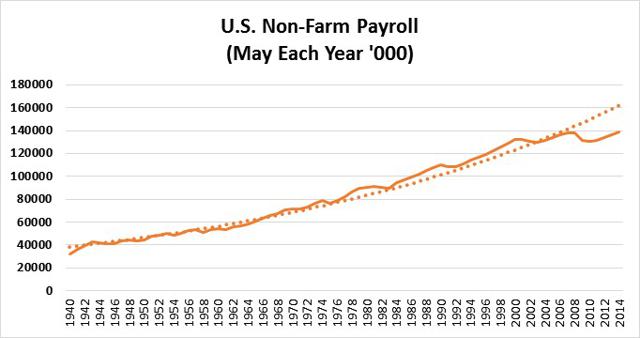
That's true. But it's not sign that we are due for a correction, rather a result of how much the market fell and how deep the recession. The chart below shows U.S. Non-Farm Employment since 1939 along with a trend line.
The U.S. economy has only just recovered to its previous peak and continues to be well below trend. We have room to grow. The remarkable fact is not that we are 5 ½ years into recovery, the post-war average, but that it's taken 5 ½ years to recover.
We can see a similar story in the stock market. Even though the market has more than doubled, it continues to be fairly valued based on historical factors.
In the introduction of my book, "The Risk Premium Factor," I say:
"The notion that the market is a mysterious arbiter of value, when, in fact, it is easy to understand and almost reptilian in response to readily observable factors. Reptiles respond in very predictable and instinctive ways using their small brains. Surprisingly, so does the market, and it's all linked to some deep-rooted psychological behavior called Loss Aversion uncovered by Daniel Kahneman and Amos Tversky in the late 1970s (Kahneman won the Nobel Prize). This book exposes the market's small brain and introduces a very simple (small-brain) model that shows that the market responds to just three factors: earnings, long-term growth, and interest rates."
The Risk Premium Factor Model exposes the simplicity by showing that market valuation can be explained by just two factors: earnings and interest rates.
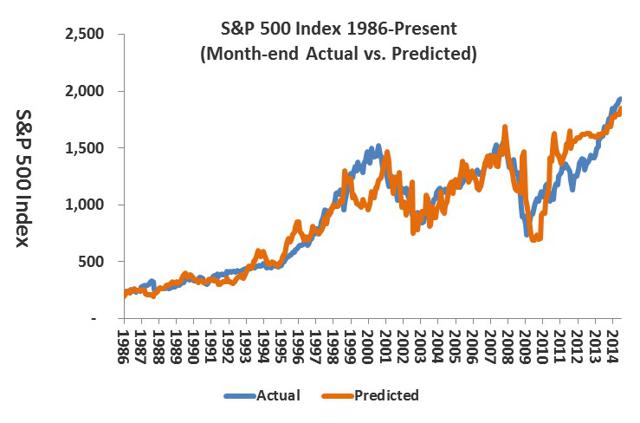
The chart below compares actual to predicted levels of the S&P 500 Index (SPY) since 1986: (click to enlarge)
The S&P 500 closed at 1,937 on June 16, 2014. While this is near a record closing high, record highs are not rare. The S&P 500 has closed at a record high over 800 times since 1960 - that's about once every 16 trading days. Bubbles are rare, record highs are expected.
The predicted value is based on The Risk Premium Factor Model (RPF for short). It is used to determine the intrinsic value of the market to help identify bubbles or buying opportunities based on earnings and interest rates. (For background on the model see my articles A simple And Powerful Model Suggests the S&P 500 Is Greatly Underpriced from September 2010 and Absurd Bubble Talk from February 28, 2014 on Seeking Alpha).
Today the model shows that the market is slightly overvalued based on trailing earnings and an estimated 4.5% 10-year yield (see the articles above for an explanation of the 4.5%). Alternatively, the model shows implied yield on the 10-year is about 4.3%.
This also means that higher long-term rates are already factored in. Of course they are. From a valuation perspective, everyone knows that at some point soon the Fed will cease its bond buying program and long-term rates will float freely. Investors price stocks today based on future expectations. They know rates will rise (but not exactly when) and have priced stocks priced accordingly.
What does this mean for equities long term?
In the long-term investors can expect returns consistent with the cost of equity - about 11%. Using the S&P's forward estimates for operating earnings and assuming long-term rates stay at 4.5% or less, the RPF models show upside for year-ends 2014 and 2015.
S&P 500
Operating Earnings |
Index Actual
|
Index Predicted
| |
16-Jun-14
|
111.92
|
1,937
|
1,847
|
31-Dec-14
|
119.82
|
Estimated
|
1,977
|
31-Dec-15
|
137.38
|
Estimated
|
2,267
|
The market is currently valued the same way it has been for at least the past 50 years. It's the same this time.
Tuesday, June 17, 2014
Long Term Jobless, Although Declining is Still High
The brief article from Market Watch basically states that although the long-term unemployed (27 weeks or more) are declining they still make up just over 1/3 (35.3% in April and 34.6% in May) of the unemployed. Just in case you were wondering why everyone is talking about a recovery, but GDP growth seems so anemic. Without a jobs recovery strong economic growth is tough.
Other sources of job information:
http://www.bls.gov/news.release/empsit.t12.htm
http://www.bls.gov/news.release/pdf/empsit.pdf
What Janet Yellen sees in her employment dashboard.
Jason Furman , chairman of the White House’s Council of Economic Advisers , pointed out after the data’s release that the long-term unemployed remain a “pressing issue,” and urged Congress to reinstate extended unemployment-insurance benefits. . . .
The brief article from Market Watch basically states that although the long-term unemployed (27 weeks or more) are declining they still make up just over 1/3 (35.3% in April and 34.6% in May) of the unemployed. Just in case you were wondering why everyone is talking about a recovery, but GDP growth seems so anemic. Without a jobs recovery strong economic growth is tough.
Other sources of job information:
http://www.bls.gov/news.release/empsit.t12.htm
http://www.bls.gov/news.release/pdf/empsit.pdf
What Janet Yellen sees in her employment dashboard.
After a flurry of ecstatic headlines over Friday's Job report, here’s one sobering statistic: the long-term jobless continue to make up more than one-third of total unemployment.
People out of work for at least 27 weeks lose hope and job-ready skills. Their families face growing financial distress. And employers often look past their resumes.
The 3.45 MM jobless workers in April who had been looking for a new spot for at least 27 weeks made up about 35.3% of total unemployed, a “disturbingly high” rate, said Gregory Daco, lead U.S. economist at Oxford Economics.
And while that share is down from 37.4% a year ago, it’s more than twice a rate of 17.4% when the recession started at the end of 2007, according to the U.S. Labor Department data.
. . . . “Fed Chair Yellen’s dashboard still suggests there is a substantial amount of slack in the labor market. We think the Fed has ample room to pursue accommodative policy and expect patience on rates,” BNP Paribas analysts wrote in a research note.
Friday, June 13, 2014
Where the Jobs Are!
Below is a short, easy to read, diagram of where the jobs are and are not. Of interest to me are the unemployment rates for the 10 worst majors and the unemployment rates for the recent grads in these majors.
from H&R Block:
Below is a short, easy to read, diagram of where the jobs are and are not. Of interest to me are the unemployment rates for the 10 worst majors and the unemployment rates for the recent grads in these majors.
from H&R Block:
Thursday, June 12, 2014
Where Did the Middle Class Jobs Go?
Below is a very interesting article originally completed by the Federal Reserve Bank of Dallas indicating where the middle class jobs are going. Basically, most of middle class jobs that required workers to follow well defined procedures are being replaced by computers. The issue of jobs being shipped overseas in a relatively smaller issue.
The article is below. The emphasis is mine. From Yahoo:
The original article is from the Federal Reserve Bank of Dallas
If your job as a bank teller, retail clerk or travel agent disappeared, would you be more likely to move up or down the employment chain?
The unfortunate answer is down, which helps explain why the loss of many middle-class jobs is having such a punishing effect on the U.S. economy and the fortunes of the typical family.
A new study by the Federal Reserve Bank of Dallas details the types of jobs that have been disappearing and validates the job stress many workers have been feeling. Between 2001 and 2011, both low-skill and high-skill jobs rose as a percentage of the total labor market, while the percentage of middle-skill jobs fell by about 10%. Middle-skills jobs have been in decline for about 20 years, according to the study, although the early part of the trend, in the 1990s, was barely noticeable. During the past 10 years, however, the loss of middle-skill jobs has intensified to the point that it now threatens the prosperity of the entire middle class.
This is the “barbell economy” some analysts have been talking about, which is characterized by swelling employment at the bottom and top of the income ladder, while the middle gets hollowed out.
Many workers fault globalization for the decline of decent-paying middle-class jobs, since big companies have moved many manufacturing plants and other types of operations overseas, where labor is cheaper. But the Dallas Fed sees that as a small factor in the loss of middle-skill jobs. A much bigger factor is the automation that has come with the digital revolution, since computers and other machines can now do many of the jobs once performed by humans. ATMs and smartphones, for example, now do much of what bank tellers once did. Travel sites such as Travelocity and Kayak serve as virtual travel agents — at no charge. There are no clerks when you check out at an e-commerce site such as Amazon or eBay.
The upside of the "nonroutine" job
Some low- and middle-skill jobs are “nonroutine,” as the Dallas Fed calls them, which means they involve hands-on work, human interaction or thinking on your feet, and therefore can’t be done effectively by a machine (not yet, anyway). Think sanitation, construction, childcare, roving security, healthcare and middle managers who make operational and personnel decisions. At the top of the chain — where the 1% reside — there’s growing demand for highly skilled professionals who must do a lot of qualitative problem-solving that requires global know-how and other rare talents.
It’s no secret that middle-class jobs have been evaporating, but this latest analysis goes a step further by drawing a distinction between routine jobs, which are threatened, and nonroutine jobs, which are safer, even if they’re at the low end of the skill ladder. The study defines routine jobs as those requiring “the ability to follow precise, well-understood procedures, which can, in principle, be carried out by a computer. ” Routine jobs can be blue-collar positions such as an assembly-line worker (increasingly being replaced by robots) or white-collar positions such as bookkeeper or insurance underwriter. Since 1981, routine jobs have dropped from 58% of the workforce to 44%.
Employers shed the most jobs during recessions, which provide an opportunity to reorganize staff and aggressively adopt labor-saving technology. This chart shows how routine jobs have disappeared at an increasing rate during the past three recessions, which started in 1990, 2001 and 2007:
The obvious implication for workers is that it’s better to have a nonroutine job than a routine one. The more your job involves thinking, creativity, innovation and problem-solving, the better off you’re likely to be.
Women, it turns out, have adapted better to this workplace dichotomy than men. Men have been more likely to move from the middle of the skill ladder to the lower end, while women tend to move from the middle to the higher end. That’s probably because women have been earning a larger share of college and graduate degrees, with better education making them more adept at climbing the skill ladder. Men at risk of falling in the other direction might want to heed the example. This chart shows the changes by gender between 1979 and 2007:
The first “jobless recovery,” in the early 1990s, was followed by nearly a decade of booming growth, which obscured its significance. That’s not likely to happen now. The development of advanced robots, drones, autonomous vehicles, artificial intelligence and other technologies could replace even more routine jobs in the future, and perhaps some nonroutine ones as well. Competing with the machines will only get more challenging.
Tuesday, June 10, 2014
Budget Deficits and Surpluses Since World War II
Below is a chart showing the the budget deficits and surpluses since WWII. The second chart shows the the period since 1969 in more detail. From one of my favorite websites Connect the Dots USA:
Saturday, June 7, 2014
"The End of History" 25 Years Later by Francis Fukuyama
25 years ago Francis Fukuyama published his famous essay called The End of History. On June 6, 2014 he published an "update" to his essay. It is worth the read. This update is below. The bold emphasis is mine. From the Wall Street Journal:
Twenty-five years ago, I wrote the essay "The End of History?" for a small journal called the National Interest. It was the spring of 1989, and for those of us who had been caught up in the big political and ideological debates of the Cold War, it was an incredible moment. The piece appeared a few months before the fall of the Berlin Wall, right about the time that pro-democracy protests were taking place in Beijing's Tiananmen Square and in the midst of a wave of democratic transitions in Eastern Europe, Latin America, Asia and sub-Saharan Africa.
I argued that History (in the grand philosophical sense) was turning out very differently from what thinkers on the left had imagined. The process of economic and political modernization was leading not to communism, as the Marxists had asserted and the Soviet Union had avowed, but to some form of liberal democracy and a market economy. History, I wrote, appeared to culminate in liberty: elected governments, individual rights, an economic system in which capital and labor circulated with relatively modest state oversight.
Looking back at that essay from the present moment, let's begin with an obvious point: The year 2014 feels very different from 1989.
Russia is a menacing electoral authoritarian regime fueled by petrodollars, seeking to bully its neighbors and take back territories lost when the Soviet Union dissolved in 1991. China remains authoritarian but now has the second-largest economy in the world, as well as its own territorial ambitions in the South and East China Seas. As the foreign-policy analyst Walter Russell Mead recently wrote, old-fashioned geopolitics has returned big time, and global stability is being threatened at both ends of Eurasia.
The problem in today's world isn't just that authoritarian powers are on the move but that many existing democracies aren't doing well either. Take Thailand, whose frayed political fabric gave way last month to a military coup, or Bangladesh, whose system remains in thrall to two corrupt political machines. Many countries that seemed to have made successful democratic transitions—Turkey, Sri Lanka, Nicaragua—have been backsliding into authoritarian practices. Others, including recent additions to the European Union like Romania and Bulgaria, are still plagued by corruption.
And then there are the developed democracies. Both the U.S. and the European Union experienced severe financial crises in the past decade, which meant anemic growth and high unemployment, especially for young people. Though the U.S. economy has now started to expand again, the benefits haven't been evenly shared, and the country's polarized and partisan political system hardly seems a shining example for other democracies.
So has my end-of-history hypothesis been proven wrong, or if not wrong, in need of serious revision? I believe that the underlying idea remains essentially correct, but I also now understand many things about the nature of political development that I saw less clearly during the heady days of 1989.
When observing broad historical trends, it is important not to get carried away by short-term developments. The hallmark of a durable political system is its long-term sustainability, not its performance in any given decade.
Let's consider, to begin with, how dramatically economic and political systems have changed over the last two generations. On the economic front, the world economy saw a massive increase in output, roughly quadrupling between the early 1970s and the financial crisis of 2007-08. Though the crisis was a large setback, levels of prosperity throughout the world have increased massively and on all continents. This has come about because the world has been knit together in a liberal system of trade and investment. Even in communist countries such as China and Vietnam, market rules and competition dominate.
Huge changes have taken place in the political sphere as well. In 1974, according to the Stanford University democracy expert Larry Diamond, there were only about 35 electoral democracies, which represented something less than 30% of the world's countries. By 2013, that number had expanded to about 120, or more than 60% of the total. The year 1989 marked only a sudden acceleration of a broader trend that the late Harvard political scientist Samuel Huntington labeled the "third wave" of democratization, a wave that had begun with the transitions in southern Europe and Latin America some 15 years earlier and would later spread to sub-Saharan Africa and Asia.
The emergence of a market-based global economic order and the spread of democracy are clearly linked. Democracy has always rested on a broad middle class, and the ranks of prosperous, property-holding citizens have ballooned everywhere in the past generation. Wealthier, better-educated populations are typically much more demanding of their governments—and because they pay taxes, they feel entitled to hold public officials accountable. Many of the world's most stubborn bastions of authoritarianism are oil-rich states such as Russia, Venezuela or the regimes in the Persian Gulf, where the "resource curse," as it has been called, gives the government enormous revenues from a source other than the people themselves.
Even granting the ability of oil-rich autocrats to resist change, we have since 2005 witnessed what Dr. Diamond calls a global "democratic recession." According to Freedom House, which publishes widely used measures of political and civil liberties, there has been a decline in both the number and the quality of democracies (integrity of elections, freedom of the press, etc.) over the past eight consecutive years.
But let's put this democratic recession in perspective: While we may worry about authoritarian trends in Russia, Thailand or Nicaragua, all of these countries were unambiguous dictatorships in the 1970s. Despite those thrilling revolutionary days in Cairo's Tahrir Square in 2011, the Arab Spring doesn't look like it will yield a real democracy anywhere but the country where it started, Tunisia. Still, it is likely to mean more responsive Arab politics over the long haul. Expectations that this would happen quickly were extremely unrealistic. We forget that following the revolutions of 1848—Europe's "Springtime of Peoples"—democracy took another 70 years to consolidate.
In the realm of ideas, moreover, liberal democracy still doesn't have any real competitors. Vladimir Putin's Russia and the ayatollahs' Iran pay homage to democratic ideals even as they trample them in practice. Why else bother to hold sham referendums on "self-determination" in eastern Ukraine? Some radicals in the Middle East may dream of restoring an Islamist caliphate, but this isn't the choice of the vast majority of people living in Muslim countries. The only system out there that would appear to be at all competitive with liberal democracy is the so-called "China model," which mixes authoritarian government with a partially market-based economy and a high level of technocratic and technological competence.
Yet if asked to bet whether, 50 years from now, the U.S. and Europe would look more like China politically or vice versa, I would pick the latter without hesitation. There are many reasons to think that the China model isn't sustainable. The system's legitimacy and the party's ongoing rule rest on continued high levels of growth, which simply won't be forthcoming as China seeks to make the transition from a middle-income country to a high-income one.
China has accumulated huge hidden liabilities by poisoning its soil and air, and while the government remains more responsive than most authoritarian systems, the country's growing middle class likely won't accept the current system of corrupt paternalism when times get tough. China no longer projects a universalistic ideal beyond its own borders, as it did in the revolutionary days of Mao. With its rising levels of inequality and the massive advantages enjoyed by the politically connected, the "Chinese dream" represents nothing more than a route for a relative few to get rich quickly.
None of this means, however, that we can rest content with democracy's performance over the past couple of decades. My end-of-history hypothesis was never intended to be deterministic or a simple prediction of liberal democracy's inevitable triumph around the world. Democracies survive and succeed only because people are willing to fight for the rule of law, human rights and political accountability. Such societies depend on leadership, organizational ability and sheer good luck.
The biggest single problem in societies aspiring to be democratic has been their failure to provide the substance of what people want from government: personal security, shared economic growth and the basic public services (especially education, health care and infrastructure) that are needed to achieve individual opportunity. Proponents of democracy focus, for understandable reasons, on limiting the powers of tyrannical or predatory states. But they don't spend as much time thinking about how to govern effectively. They are, in Woodrow Wilson's phrase, more interested in "controlling than in energizing government."
This was the failure of the 2004 Orange Revolution in Ukraine, which toppled Viktor Yanukovych for the first time. The leaders who came to power through those protests—Viktor Yushchenko and Yulia Tymoshenko—wasted their energy on internal squabbling and shady deals. Had an effective democratic administration come to power, cleaning up corruption in Kiev and making the state's institutions more trustworthy, the government might have established its legitimacy across Ukraine, including the Russian-speaking east, long before Mr. Putin was strong enough to interfere. Instead, the democratic forces discredited themselves and paved the way for Mr. Yanukovych's return in 2010, thus setting the stage for the tense, bloody standoff of recent months.
India has been held back by a similar gap in performance when compared with authoritarian China. It is very impressive that India has held together as a democracy since its founding in 1947. But Indian democracy, like sausage-making, doesn't look very appealing on closer inspection. The system is rife with corruption and patronage; 34% of the winners of India's recent elections have criminal indictments pending against them, according to India's Association for Democratic Reforms, including serious charges like murder, kidnapping and sexual assault.
The rule of law exists in India, but it is so slow and ineffective that many plaintiffs die before their cases come to trial. The Indian Supreme Court has a backlog of more than 60,000 cases, according to the Hindustan Times. Compared with autocratic China, the world's largest democracy has been completely hamstrung in its ability to provide modern infrastructure or basic services such as clean water, electricity or basic education to its population.
In some Indian states, 50% of schoolteachers fail to show up for work, according to the economist and activist Jean Drèze. Narendra Modi, a Hindu nationalist with a troubling past of tolerating anti-Muslim violence, has just been elected prime minister by an impressive majority in the hope that he will somehow cut through all the blather of routine Indian politics and actually get something done.
Americans, more than other people, often fail to understand the need for effective government, focusing instead on the constraint of authority. In 2003, the George W. Bush administration seemed to believe that democratic government and a market-oriented economy would spontaneously emerge in Iraq once the U.S. had eliminated Saddam Hussein's dictatorship. It didn't understand that these arise from the interaction of complex institutions—political parties, courts, property rights, shared national identity—that have evolved in developed democracies over many decades, even centuries.
The inability to govern effectively extends, unfortunately, to the U.S. itself. Our Madisonian Constitution, deliberately designed to prevent tyranny by multiplying checks and balances at all levels of government, has become a vetocracy. In the polarized—indeed poisonous—political atmosphere of today's Washington, the government has proved unable to move either forward or backward effectively.
Contrary to the hysterics on either side, the U.S. faces a very serious long-term fiscal problem that is nonetheless solvable through sensible political compromises. But Congress hasn't passed a budget, according to its own rules, in several years, and last fall, the GOP shut down the entire government because it couldn't agree on paying for past debts. Though the U.S. economy remains a source of miraculous innovation, American government is hardly a source of inspiration around the world at the present moment.
Twenty-five years later, the most serious threat to the end-of-history hypothesis isn't that there is a higher, better model out there that will someday supersede liberal democracy; neither Islamist theocracy nor Chinese capitalism cuts it. Once societies get on the up escalator of industrialization, their social structure begins to change in ways that increase demands for political participation. If political elites accommodate these demands, we arrive at some version of democracy.
The question is whether all countries will inevitably get on that escalator. The problem is the intertwining of politics and economics. Economic growth requires certain minimal institutions such as enforceable contracts and reliable public services before it will take off, but those basic institutions are hard to create in situations of extreme poverty and political division. Historically, societies broke out of this "trap" through accidents of history, in which bad things (like war) often created good things (like modern governments). It is not clear, however, that the stars will necessarily align for everyone.
A second problem that I did not address 25 years ago is that of political decay, which constitutes a down escalator. All institutions can decay over the long run. They are often rigid and conservative; rules responding to the needs of one historical period aren't necessarily the right ones when external conditions change.
Moreover, modern institutions designed to be impersonal are often captured by powerful political actors over time. The natural human tendency to reward family and friends operates in all political systems, causing liberties to deteriorate into privileges. This is no less true in a democracy (look at the current U.S. tax code) than in an authoritarian system. In these circumstances, the rich tend to get richer not just because of higher returns to capital, as the French economist Thomas Piketty has argued, but because they have superior access to the political system and can use their connections to promote their interests.
As for technological progress, it is fickle in distributing its benefits. Innovations such as information technology spread power because they make information cheap and accessible, but they also undermine low-skill jobs and threaten the existence of a broad middle class.
No one living in an established democracy should be complacent about its survival. But despite the short-term ebb and flow of world politics, the power of the democratic ideal remains immense. We see it in the mass protests that continue to erupt unexpectedly from Tunis to Kiev to Istanbul, where ordinary people demand governments that recognize their equal dignity as human beings. We also see it in the millions of poor people desperate to move each year from places like Guatemala City or Karachi to Los Angeles or London.
Even as we raise questions about how soon everyone will get there, we should have no doubt as to what kind of society lies at the end of History.
Mr. Fukuyama is a senior fellow at Stanford University's Freeman Spogli Institute for International Studies and the author of "Political Order and Political Decay: From the Industrial Revolution to the Globalization of Democracy," which will be published on Oct. 1 by Farrar, Straus and Giroux.
Subscribe to:
Posts (Atom)