Below is an article from Steve Hassett at Seeking Alpha. It is a short description of Steve's view of the stock market and the fact that currently "nothing is new it, it is the same old stuff". Steve has a relatively simple model of the stock market the Risk Premium Factor and he has fairly good luck predicting future price of the S&P 500.
By the way, for those of you who do not peruse Seeking Alpha from time to time you are missing an excellent resource on investing, finance, and economics. Is everything you see on the site good - no, of course not. But there is a lot of really good analysis on this site.
S&P Fairly Valued Because 'It's The Same This Time'
Summary
- Room to grow. Despite the exceeding the post-war average for economic recoveries, U.S. employment has only just matched the previous peak.
- Record highs are not rare and not indicative of a bubble. Since 1960, the S&P 500 Index has hit a new closing high over 800 times.
- It's not different this time. The market has been valued based on the same predictable factors since at least 1960.
Some argue that we are in an unusually strong or long recovery for the stock market and the overall economy.
That's true. But it's not sign that we are due for a correction, rather a result of how much the market fell and how deep the recession. The chart below shows U.S. Non-Farm Employment since 1939 along with a trend line.
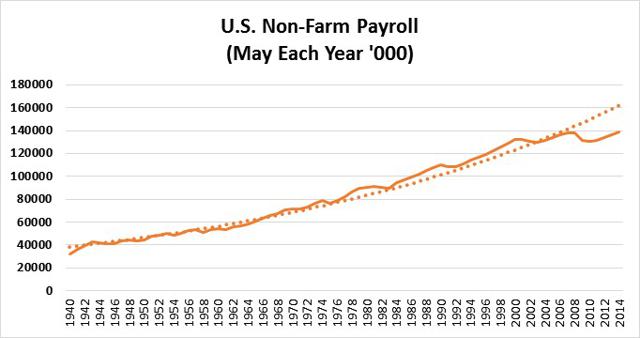
The U.S. economy has only just recovered to its previous peak and continues to be well below trend. We have room to grow. The remarkable fact is not that we are 5 ½ years into recovery, the post-war average, but that it's taken 5 ½ years to recover.
We can see a similar story in the stock market. Even though the market has more than doubled, it continues to be fairly valued based on historical factors.
In the introduction of my book, "The Risk Premium Factor," I say:
"The notion that the market is a mysterious arbiter of value, when, in fact, it is easy to understand and almost reptilian in response to readily observable factors. Reptiles respond in very predictable and instinctive ways using their small brains. Surprisingly, so does the market, and it's all linked to some deep-rooted psychological behavior called Loss Aversion uncovered by Daniel Kahneman and Amos Tversky in the late 1970s (Kahneman won the Nobel Prize). This book exposes the market's small brain and introduces a very simple (small-brain) model that shows that the market responds to just three factors: earnings, long-term growth, and interest rates."
The Risk Premium Factor Model exposes the simplicity by showing that market valuation can be explained by just two factors: earnings and interest rates.
The chart below compares actual to predicted levels of the S&P 500 Index (SPY) since 1986: (click to enlarge)
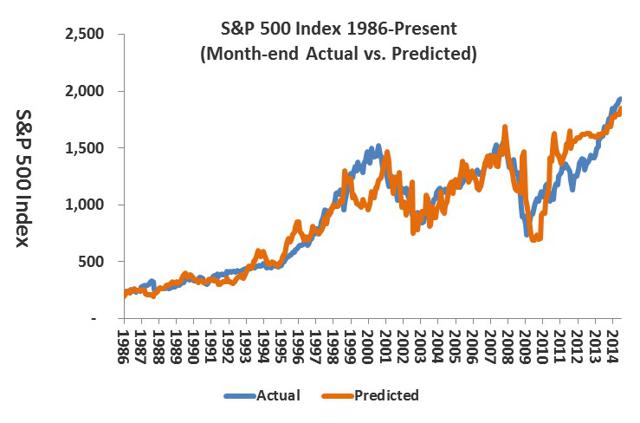
The S&P 500 closed at 1,937 on June 16, 2014. While this is near a record closing high, record highs are not rare. The S&P 500 has closed at a record high over 800 times since 1960 - that's about once every 16 trading days. Bubbles are rare, record highs are expected.
The predicted value is based on The Risk Premium Factor Model (RPF for short). It is used to determine the intrinsic value of the market to help identify bubbles or buying opportunities based on earnings and interest rates. (For background on the model see my articles A simple And Powerful Model Suggests the S&P 500 Is Greatly Underpriced from September 2010 and Absurd Bubble Talk from February 28, 2014 on Seeking Alpha).
Today the model shows that the market is slightly overvalued based on trailing earnings and an estimated 4.5% 10-year yield (see the articles above for an explanation of the 4.5%). Alternatively, the model shows implied yield on the 10-year is about 4.3%.
This also means that higher long-term rates are already factored in. Of course they are. From a valuation perspective, everyone knows that at some point soon the Fed will cease its bond buying program and long-term rates will float freely. Investors price stocks today based on future expectations. They know rates will rise (but not exactly when) and have priced stocks priced accordingly.
What does this mean for equities long term?
In the long-term investors can expect returns consistent with the cost of equity - about 11%. Using the S&P's forward estimates for operating earnings and assuming long-term rates stay at 4.5% or less, the RPF models show upside for year-ends 2014 and 2015.
S&P 500
Operating Earnings |
Index Actual
|
Index Predicted
| |
16-Jun-14
|
111.92
|
1,937
|
1,847
|
31-Dec-14
|
119.82
|
Estimated
|
1,977
|
31-Dec-15
|
137.38
|
Estimated
|
2,267
|
The market is currently valued the same way it has been for at least the past 50 years. It's the same this time.
No comments:
Post a Comment